
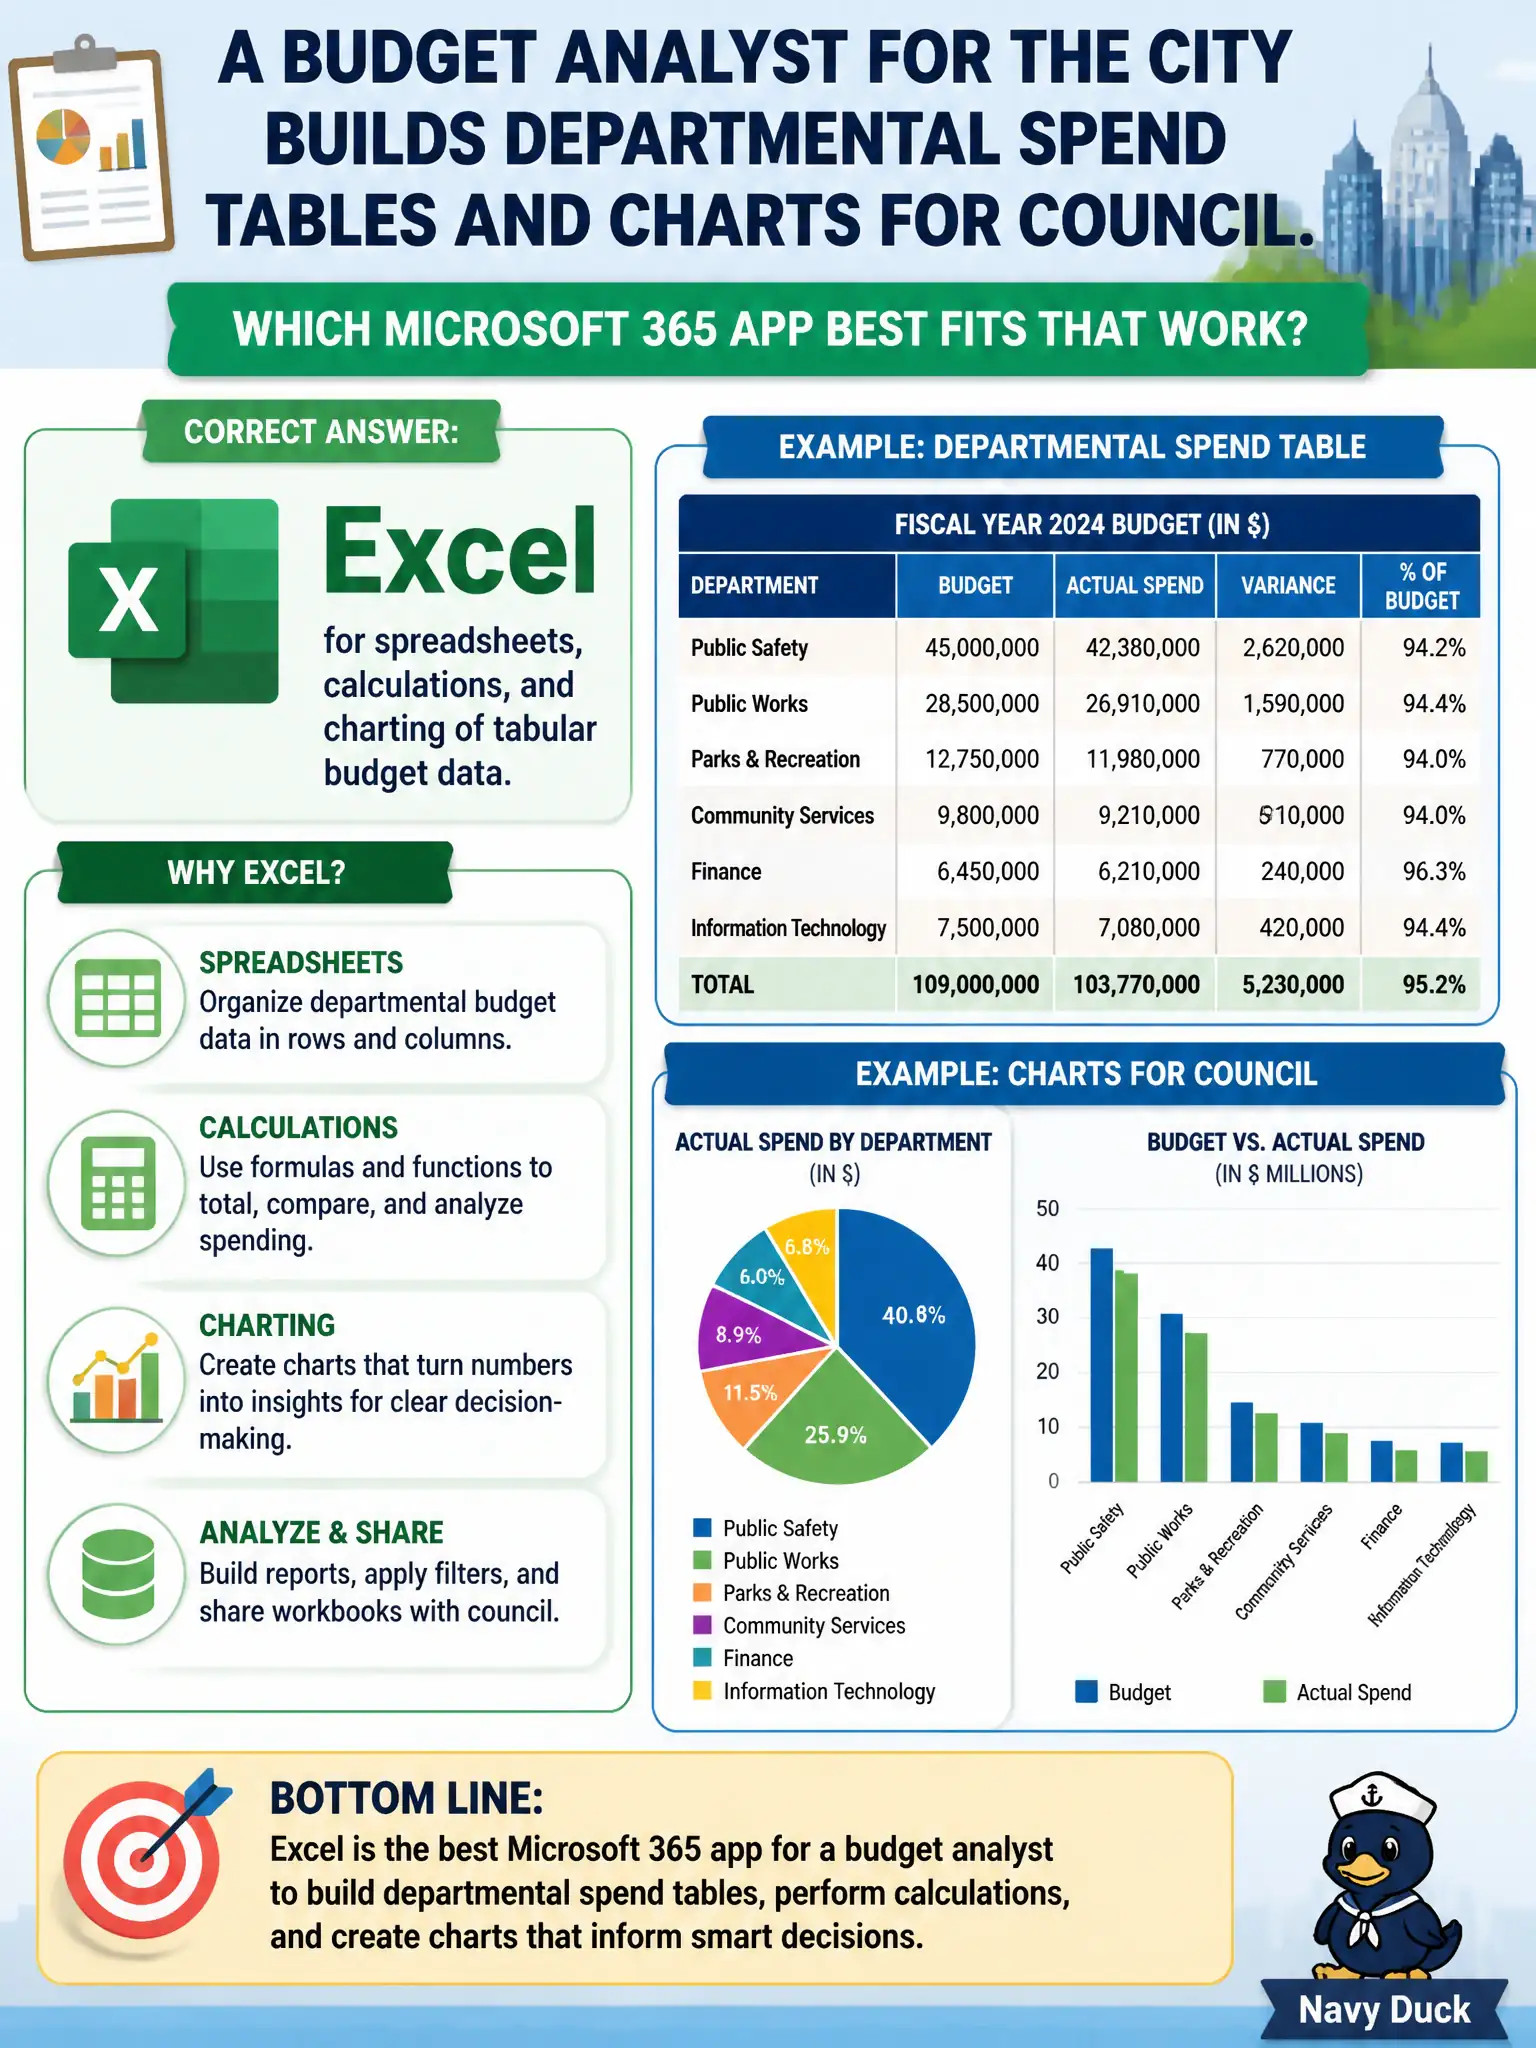
A budget analyst for the city builds departmental spend tables and charts for council. Which Microsoft 365 app best fits that work?
Select an answer to reveal the explanation.
Short Explanation
Budget tables and charts live in Excel territory. Think rows, formulas, and visuals for council—not a slide-first deck or a free-form notebook. When the job is numbers and charts, Excel is the productivity fit.
Full Explanation
Excel is the Microsoft 365 app built for spreadsheets, calculations, and charting of tabular data—exactly what a city budget analyst needs for departmental spend tables and council-facing charts. Structured numeric models, formulas, and visuals live naturally in workbooks rather than in slides, notebooks, or booking tools as the system of analysis.
PowerPoint fails as the best fit for building the underlying spend tables because slides present stories; they are not the primary calculation engine. OneNote fails because free-form notebooks lack the structured grid, formulas, and charting depth budget work requires. Bookings fails conceptually: appointment scheduling does not double as a financial model for departmental spend.
Exam caveat: Excel models used for public hearings should still be validated, access-controlled, and archived so figures shown to council can be reproduced later. Operational check: store the budget workbook in a controlled library, restrict edit rights to finance analysts, and link approved charts into the hearing deck without emailing uncontrolled copies. Record the choice in the municipal service catalog so help-desk scripts stay consistent. Record the choice in the municipal service catalog so help-desk scripts stay consistent.