
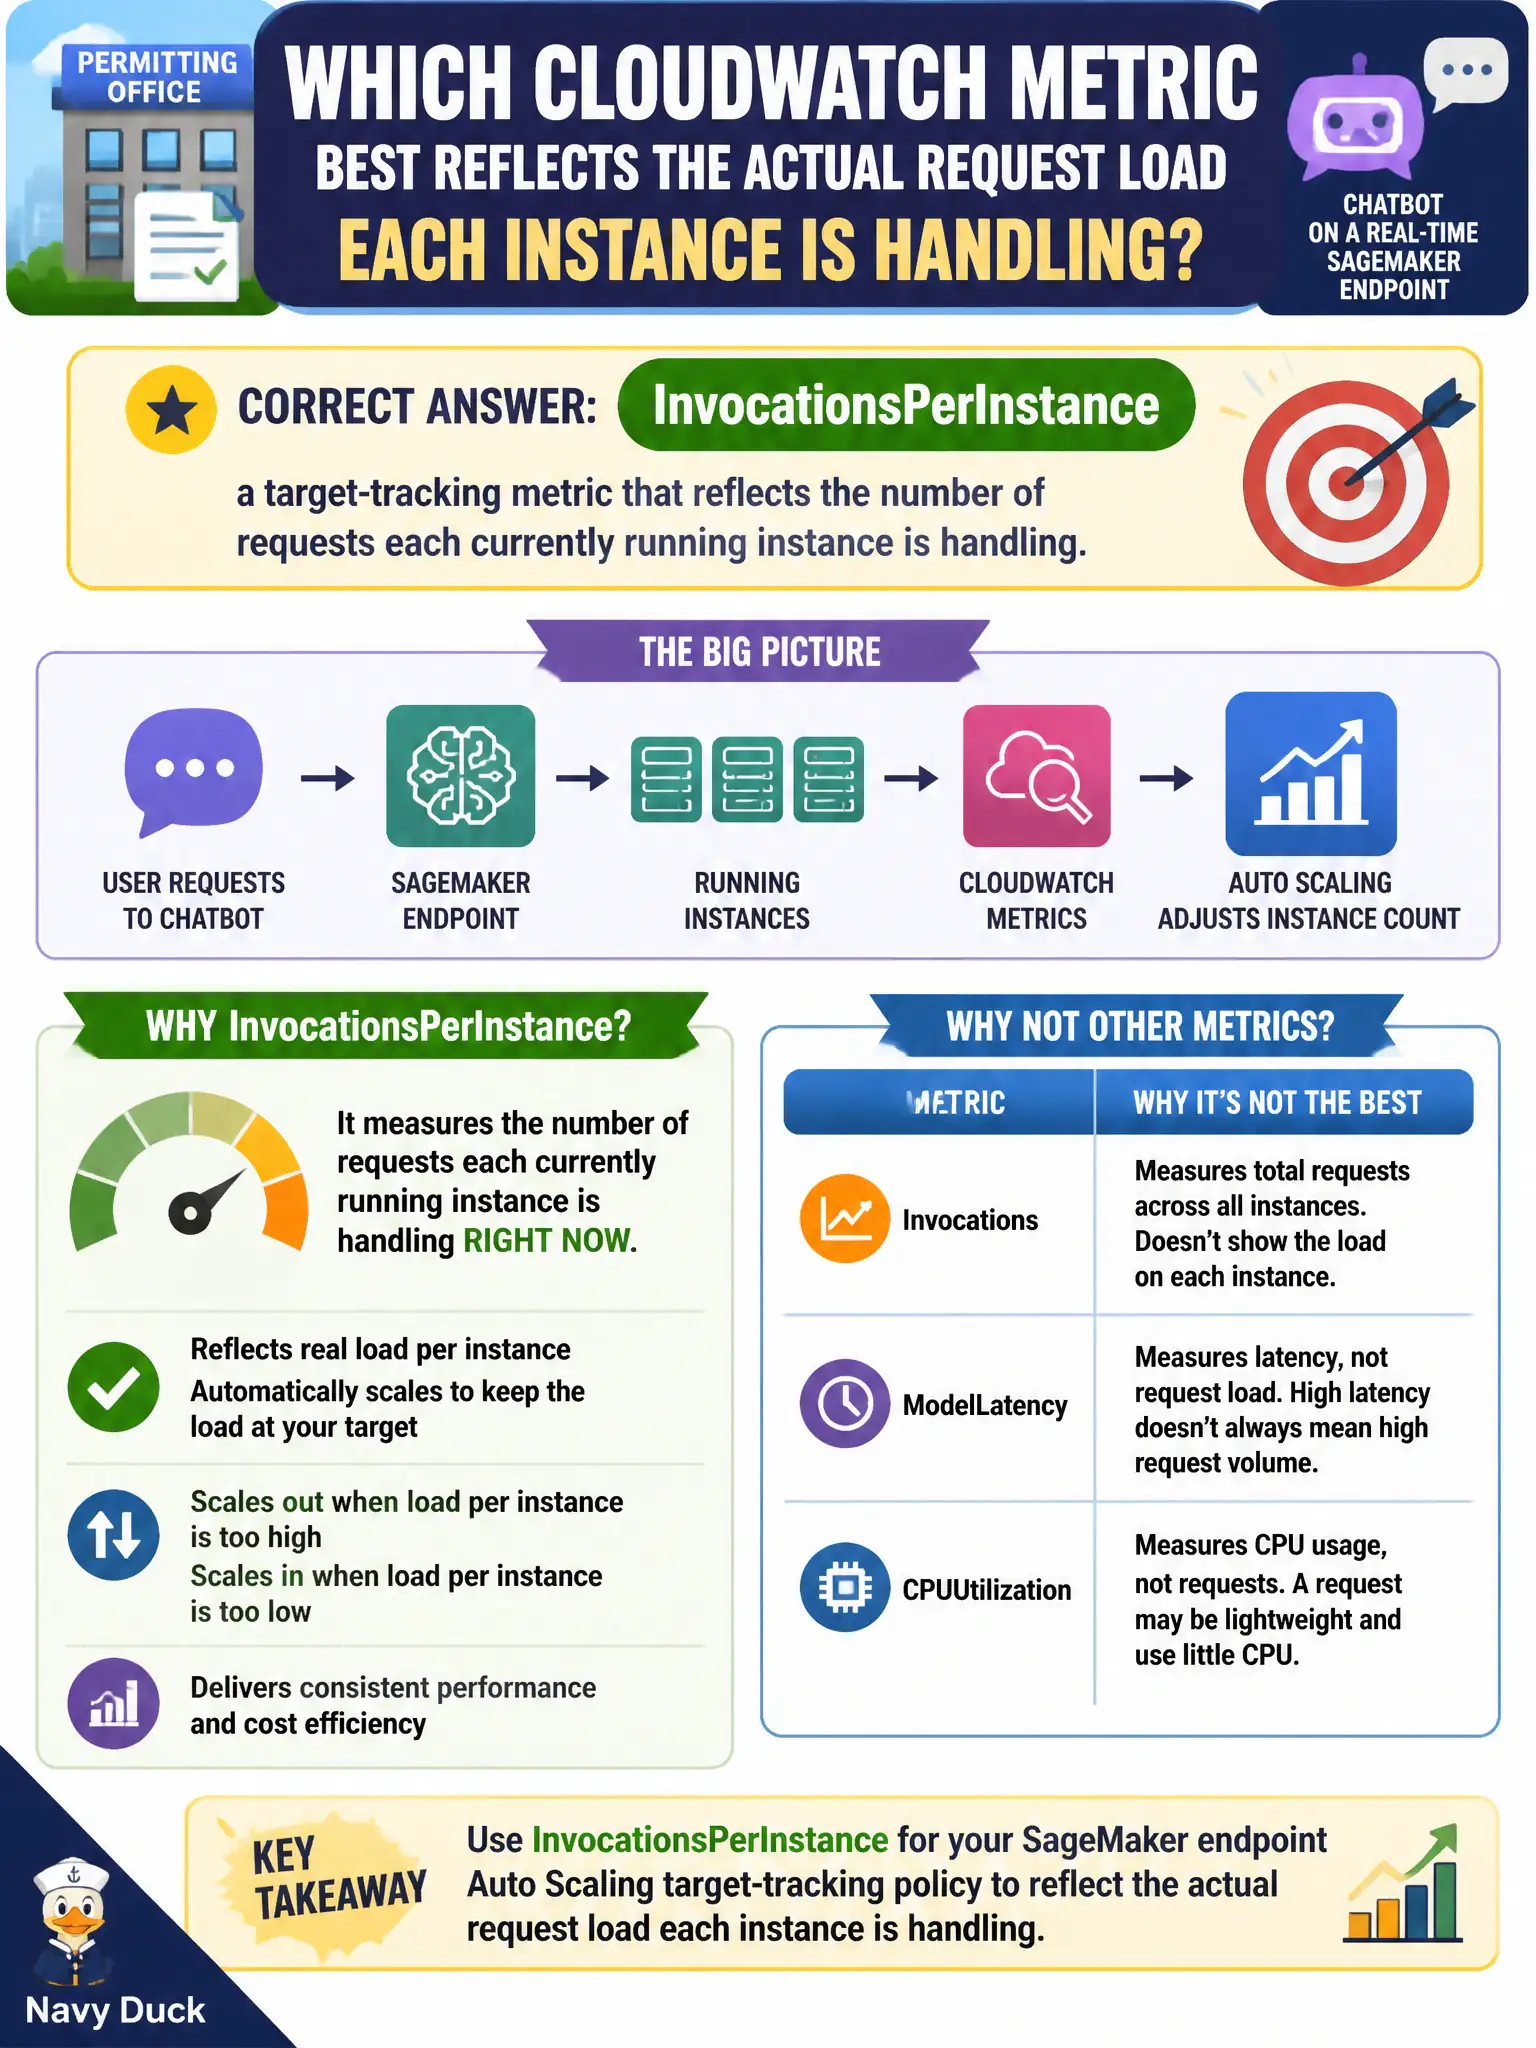
A permitting office's chatbot runs on a real-time SageMaker endpoint, and the platform team must pick a CloudWatch metric to drive an Auto Scaling target-tracking policy for the endpoint's instance count. Which metric best reflects the actual request load each instance is handling?
Select an answer to reveal the explanation.
Short Explanation
Think of each endpoint instance like a barista working a counter: what tells you whether to call in backup isn't how hot the espresso machine feels, it's how many drinks each barista is juggling right now. InvocationsPerInstance measures exactly that — requests per running instance — so target-tracking on it scales the fleet to match real demand. CPU can run hot for reasons that have nothing to do with request volume, so it's a noisier stand-in.
Full Explanation
SageMaker publishes InvocationsPerInstance specifically so Auto Scaling can target-track a per-instance workload figure: you set a target value, and the scaling policy adds or removes instances to keep actual invocations-per-instance near that target, which scales in proportion to real traffic. CPUUtilization reflects host-level resource pressure, which can spike from background processes or an inefficient model without a corresponding rise in request volume, so it can trigger scaling that doesn't track demand. ModelLatency alone conflates cause and effect — latency can rise from many sources (a cold instance, a large payload, a downstream call) and using it as the sole target risks either over-scaling on a transient blip or reacting too late once residents already notice slow replies. The count of loaded models is a multi-model-endpoint sizing concern, not a signal of how loaded any single instance currently is. Scope caveat: for bursty, unpredictable traffic, pair target-tracking with a modest scale-out cooldown so the fleet doesn't oscillate. Operational check: graph InvocationsPerInstance against ModelLatency during a load test and confirm the scaling policy keeps latency flat as invocations climb.