
A security engineer is building a Microsoft Sentinel hunting notebook to detect anomalous patterns in Azure OpenAI usage using machine learning-based time-series analysis. Which KQL function enables detecting statistical anomalies in the number of Azure OpenAI API calls per hour over the past 30 days?
Select an answer to reveal the explanation.
Short Explanation
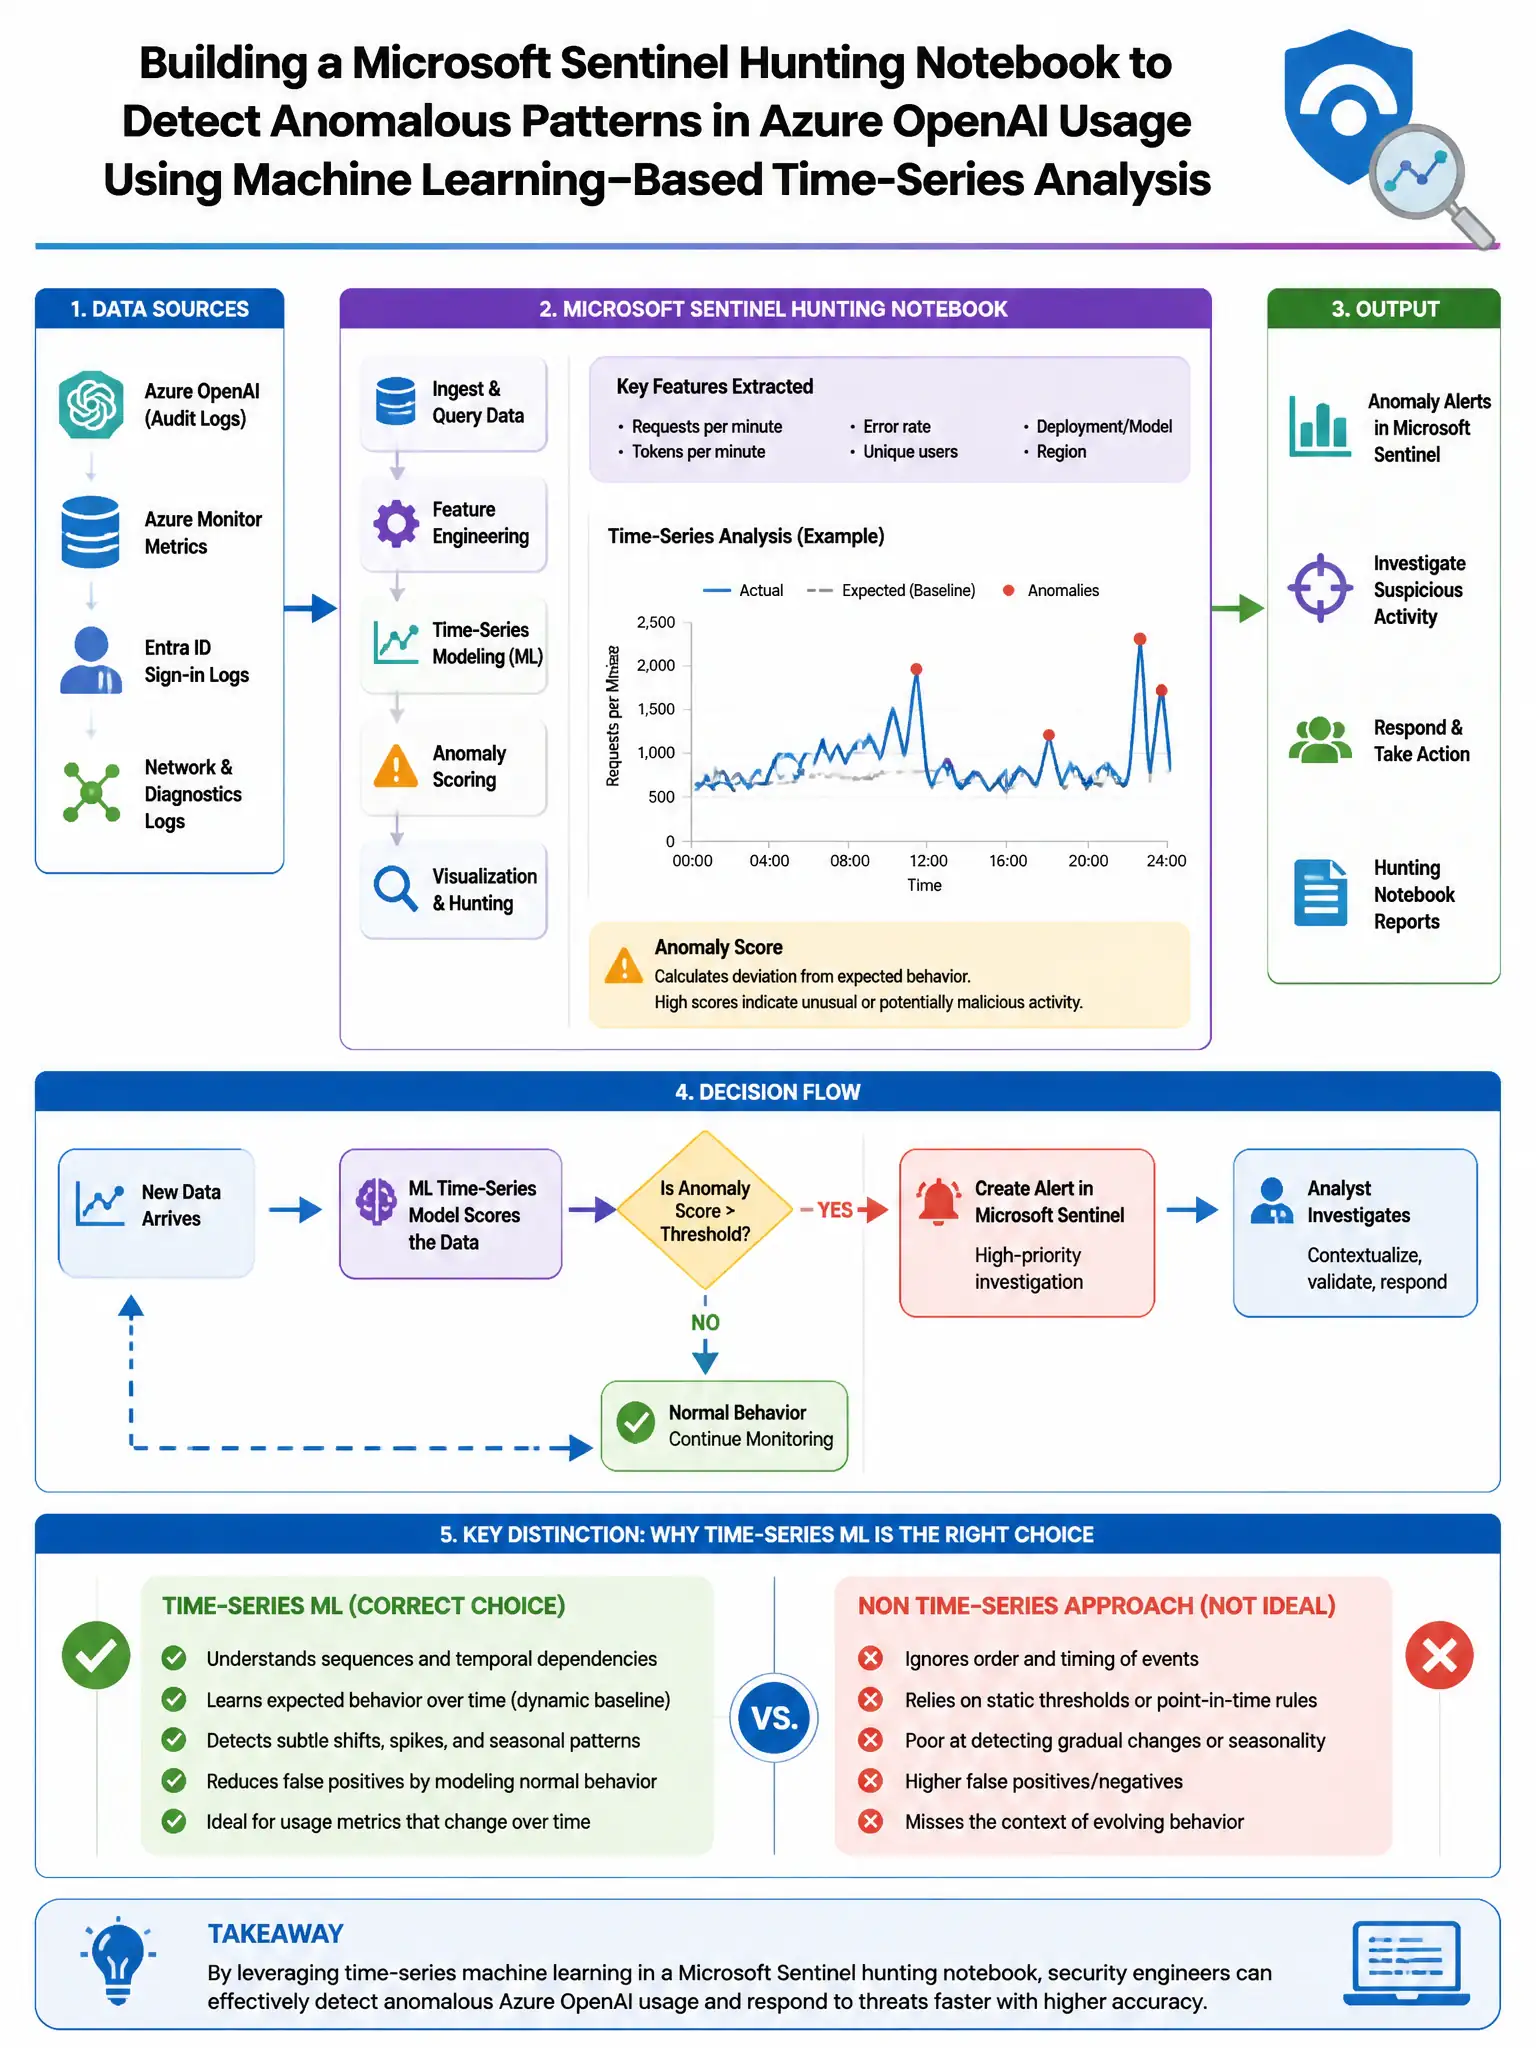
You need make_series() to turn hourly Azure OpenAI API call counts into time-series data, then series_decompose_anomalies() to spot points that break expected trend and seasonality. It adapts to normal patterns instead of relying on fixed cutoffs.
Full Explanation
The correct approach is series_decompose_anomalies() applied to time-series data created with make_series(). make_series() builds hourly series from log data, such as Azure OpenAI API call counts per hour over the past 30 days, and series_decompose_anomalies() applies statistical model to detect points that deviate significantly from expected seasonal and trend patterns. This is more sophisticated than static thresholds because it adapts to normal usage, such as lower calls on weekends and higher calls on business days. The summarize count() by bin(TimeGenerated, 1h) with threshold filter approach is wrong because static threshold-based count comparison does not adapt to usage patterns and generates more false positives during legitimate peaks or misses anomalies during normally quiet periods. The arg_max() approach to find the peak usage hour is wrong because arg_max() finds record with maximum value in group; it identifies peak but does not perform anomaly detection relative to historical pattern. The percentile() approach to find the 95th percentile of call volume is wrong because percentile() calculates distribution percentiles for threshold setting; it is static-analysis measure, not time-series anomaly detection function.