
A pipeline's Notebook activity, which runs a PySpark notebook that cleans OCR text from scanned oral-history transcripts, fails. The pipeline's own run history simply shows the activity as failed with a generic message that the notebook run did not complete successfully. What should the engineer do to find the actual root cause?
Select an answer to reveal the explanation.
Short Explanation
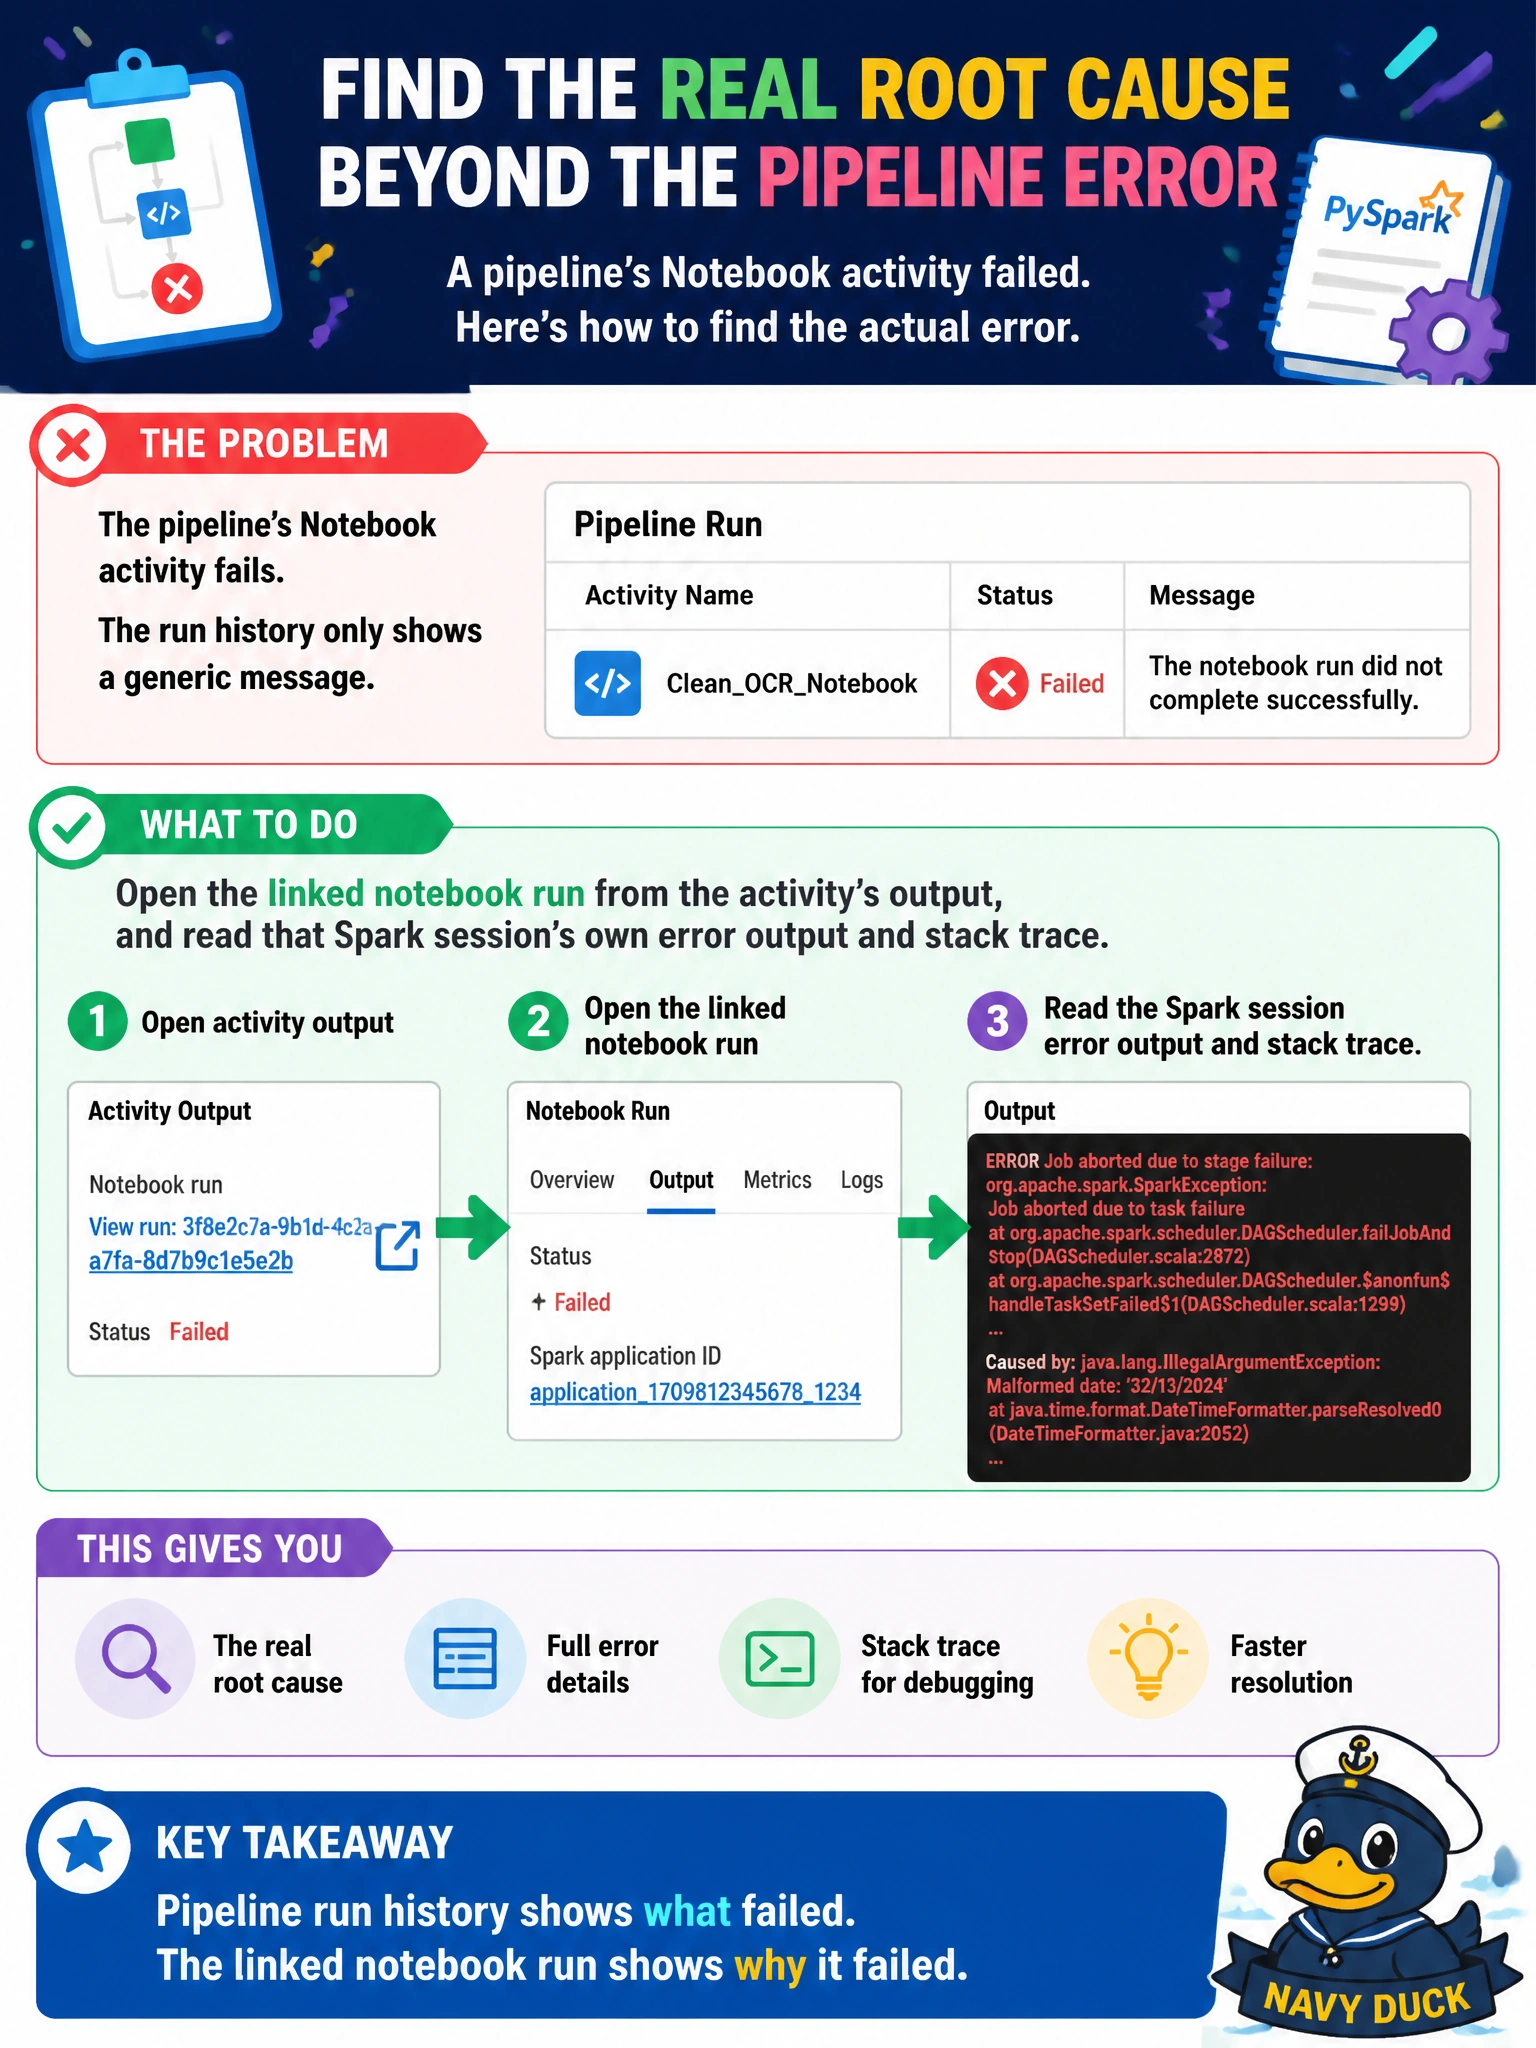
Think of the pipeline as the person who dialed the phone and the notebook as the one who actually had the conversation that went badly. The pipeline only knows the call didn't go well — it wasn't in the room. To find out what really happened, you go listen to the notebook's own session, not the dialer's summary.
Full Explanation
A Notebook activity in a pipeline is just a trigger for a separate Spark session, and the pipeline's monitoring view only reports whether that session ended successfully — it does not surface the notebook's internal cell-by-cell output. The activity's run detail includes a link to the actual notebook run, and opening that shows the Spark application's own logs, including which cell failed and the underlying stack trace, such as a malformed row of OCR text breaking a parsing step. Re-running the pipeline without investigating just repeats the same failure if the root cause is a genuine data or code problem rather than a transient blip. Checking tenant-wide capacity throttling is worth doing when jobs fail to even start or queue for a long time, but a notebook that ran and then failed partway through points to a logic or data issue inside the code, not a capacity ceiling. Deleting and recreating the activity discards the pipeline's configuration without adding any diagnostic information and would not reveal why the underlying Spark code failed. As a concrete check, confirm which cell number the stack trace points to and inspect the specific transcript batch it was processing before assuming the fix applies to the whole dataset.