
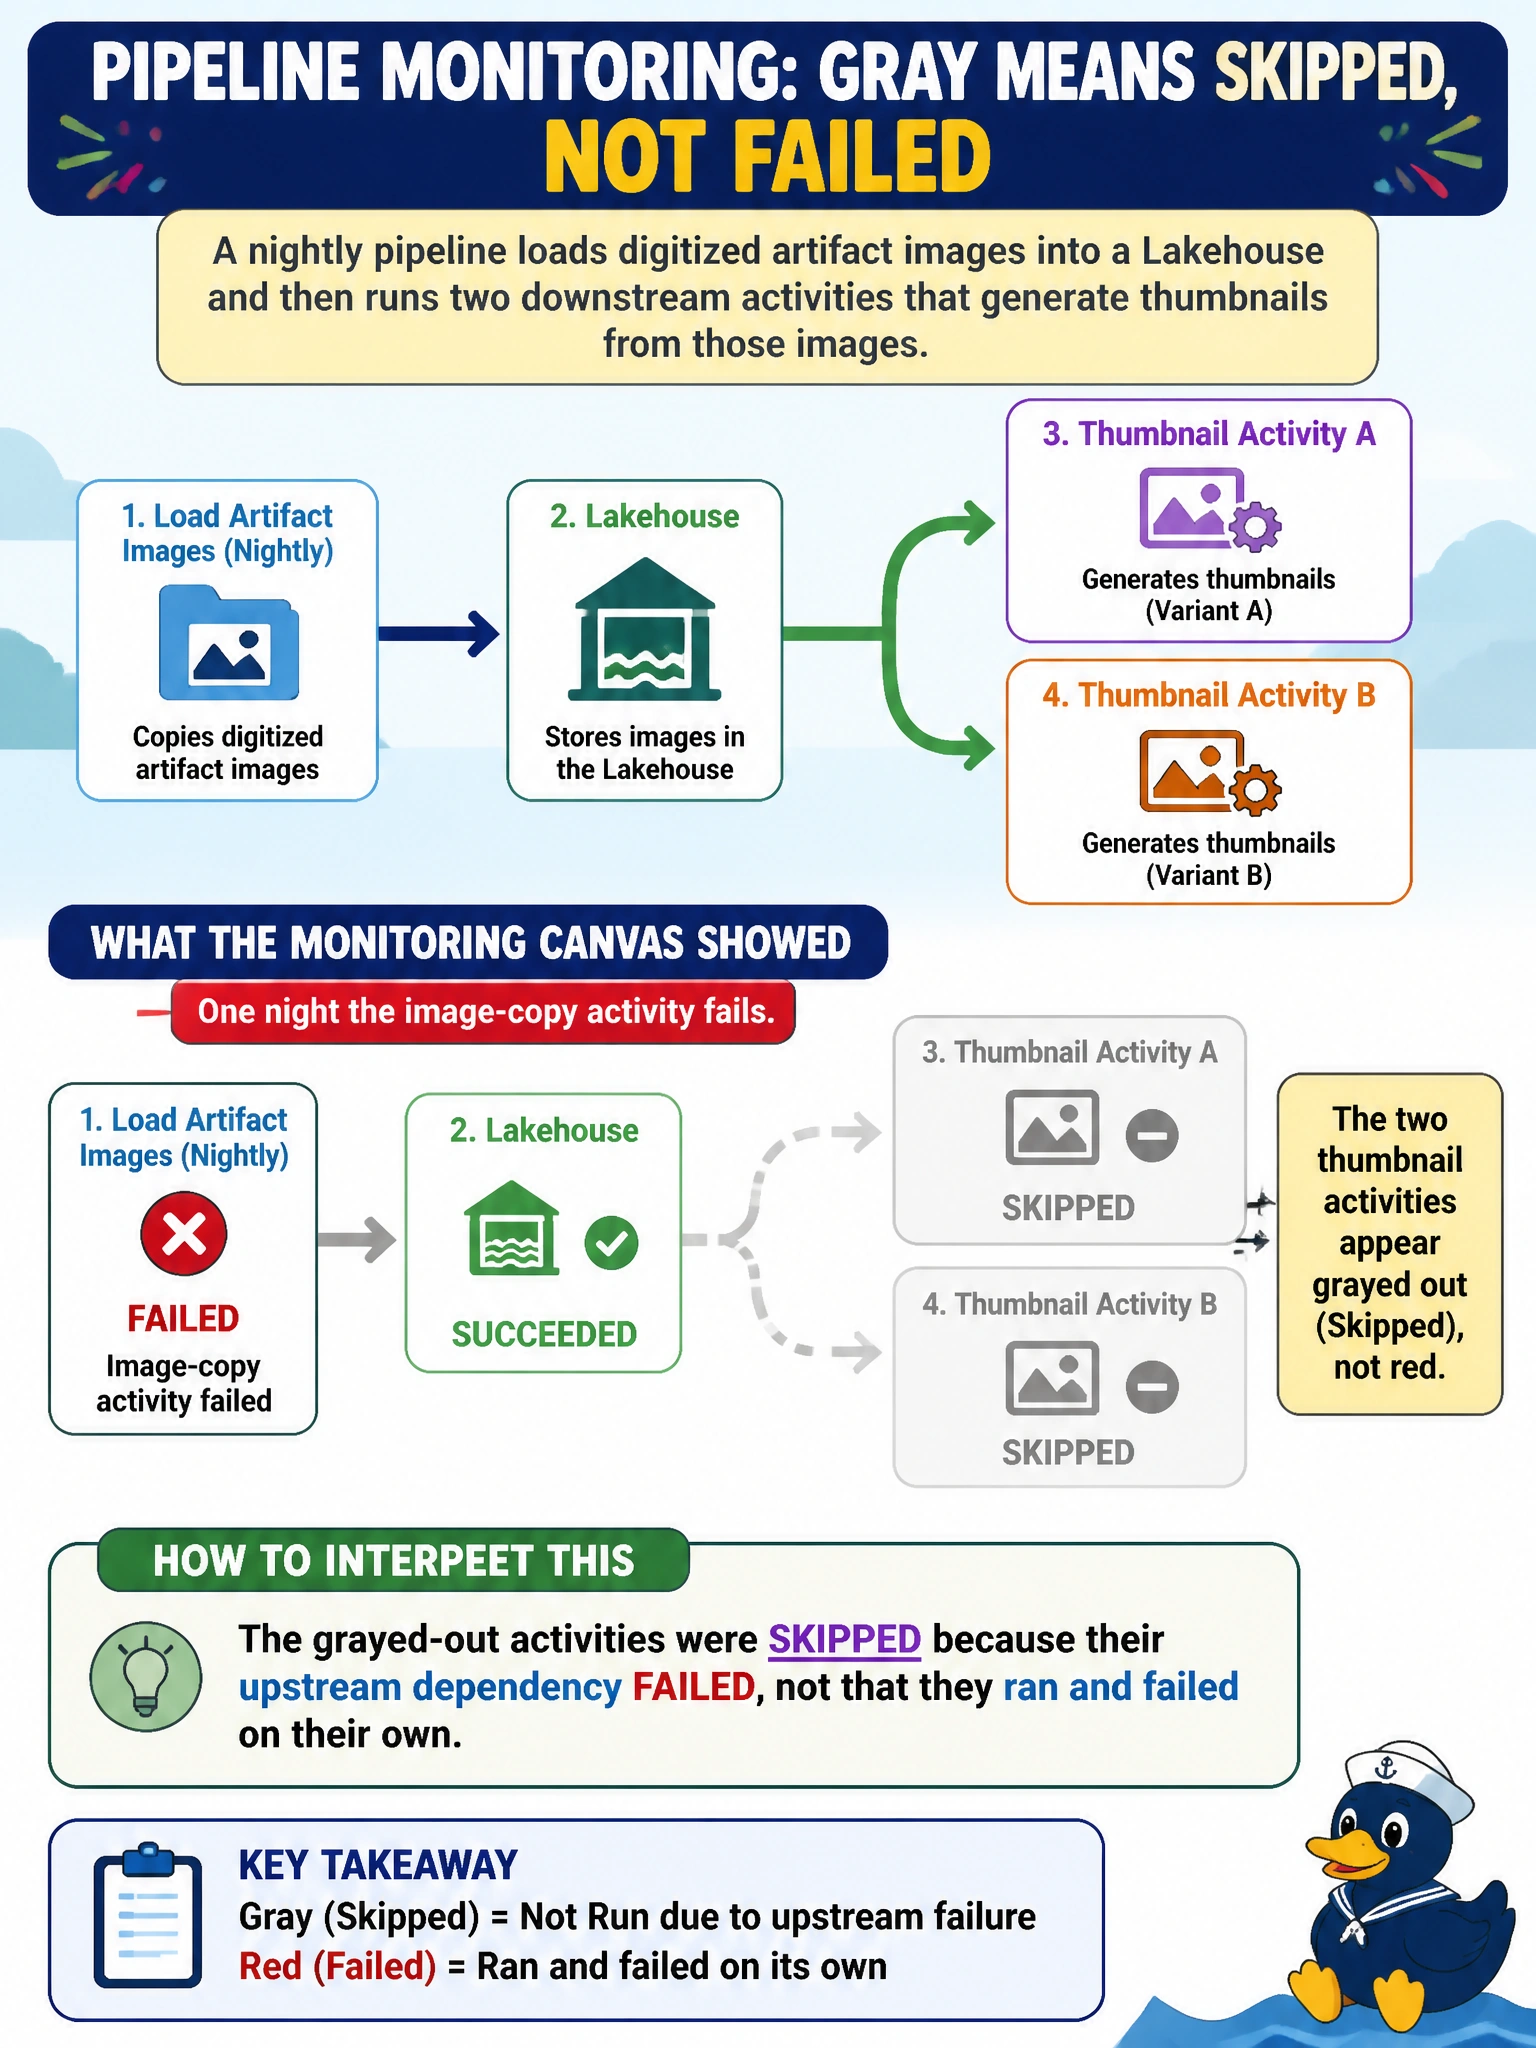
A nightly pipeline loads digitized artifact images into a Lakehouse and then runs two downstream activities that generate thumbnails from those images. One night the image-copy activity fails, and in the pipeline's monitoring canvas the two thumbnail activities appear grayed out instead of red. How should the engineer interpret this?
Select an answer to reveal the explanation.
Short Explanation
Gray in a pipeline's run graph means "never got the chance," not "tried and gave up." It's the difference between a relay runner who dropped the baton and the next two runners who simply never left the starting block. Reading that status correctly tells you the real failure is upstream, at the image copy, and there's nothing to debug in the thumbnail steps themselves.
Full Explanation
Fabric's pipeline monitoring canvas uses distinct visual states for each activity in a run: succeeded, failed, and skipped, the last shown in gray when an activity's dependency condition was not met because an upstream activity it depends on failed. That is exactly what happened here — the thumbnail activities were configured to run only after a successful copy, so when the copy failed, they never executed at all, and there is no code or configuration inside them to investigate. Treating gray as a quiet success would be wrong, since a skipped activity produces no output whatsoever, not an output that silently failed to land. Treating it as still-queued misreads the run as incomplete, when the run has actually finished and reported its final state for every activity, including the skipped ones. A monitoring outage would typically show as missing or stale data across the whole workspace, not a clean, consistent gray applied only to the activities downstream of one specific failure. The concrete check is to open the failed copy activity first, since fixing it and re-running the pipeline is what allows the skipped thumbnail activities to execute on the next attempt.