
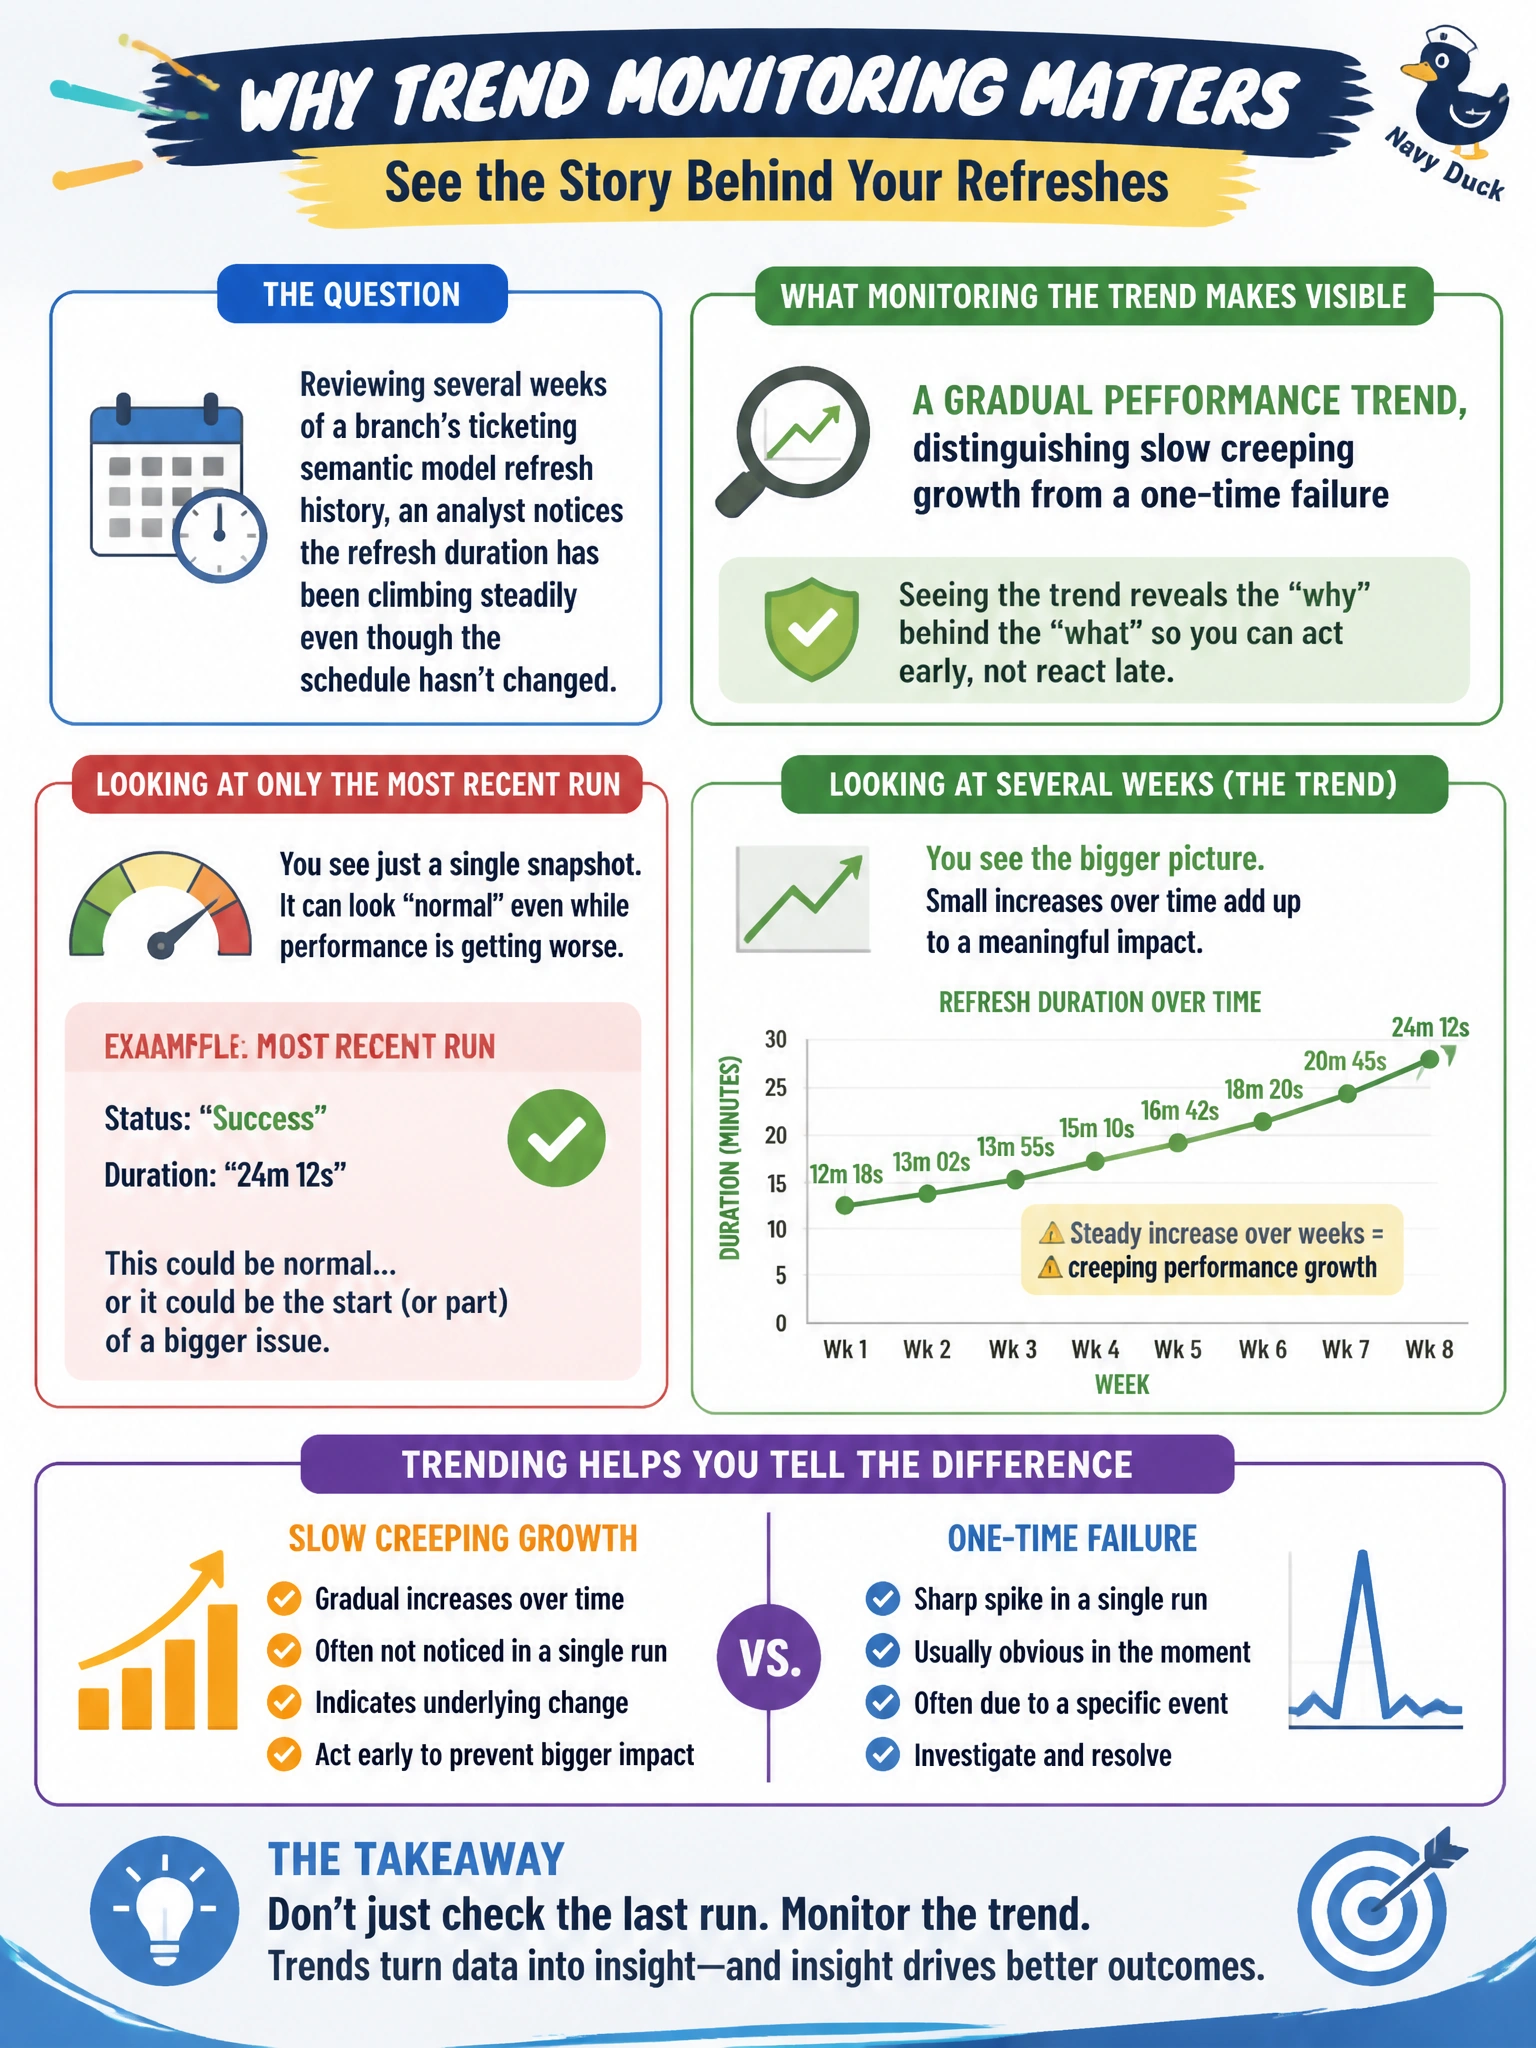
Reviewing several weeks of a branch's ticketing semantic model refresh history, an analyst notices the refresh duration has been climbing steadily even though the schedule hasn't changed. What does monitoring this trend, rather than only the most recent run, make visible that a single run's status would not?
Select an answer to reveal the explanation.
Short Explanation
Looking at one refresh is a snapshot; looking at weeks of them is a flip-book. A flip-book is what shows the duration creeping up gradually instead of just one bad night.
Full Explanation
Reviewing refresh history across many runs surfaces trends over time, such as a duration that climbs gradually week over week, which a single run's pass-or-fail status cannot reveal on its own since any individual recent run might still show "succeeded" even while quietly taking longer than it used to. Whether the model's workspace carries a correct sensitivity label is a governance and classification concern entirely separate from refresh performance history. Checking only the most recent single refresh's outcome answers whether last night worked, but says nothing about the multi-week pattern the analyst is trying to catch before it becomes an outright failure. Row-level security role configuration governs what different users can see within the model's data; it has no bearing on refresh duration trends. Having spotted the trend, a reasonable next step is correlating it against growing source data volume or an increasing number of concurrent refreshes competing for the same capacity, since either could explain steadily rising duration.