
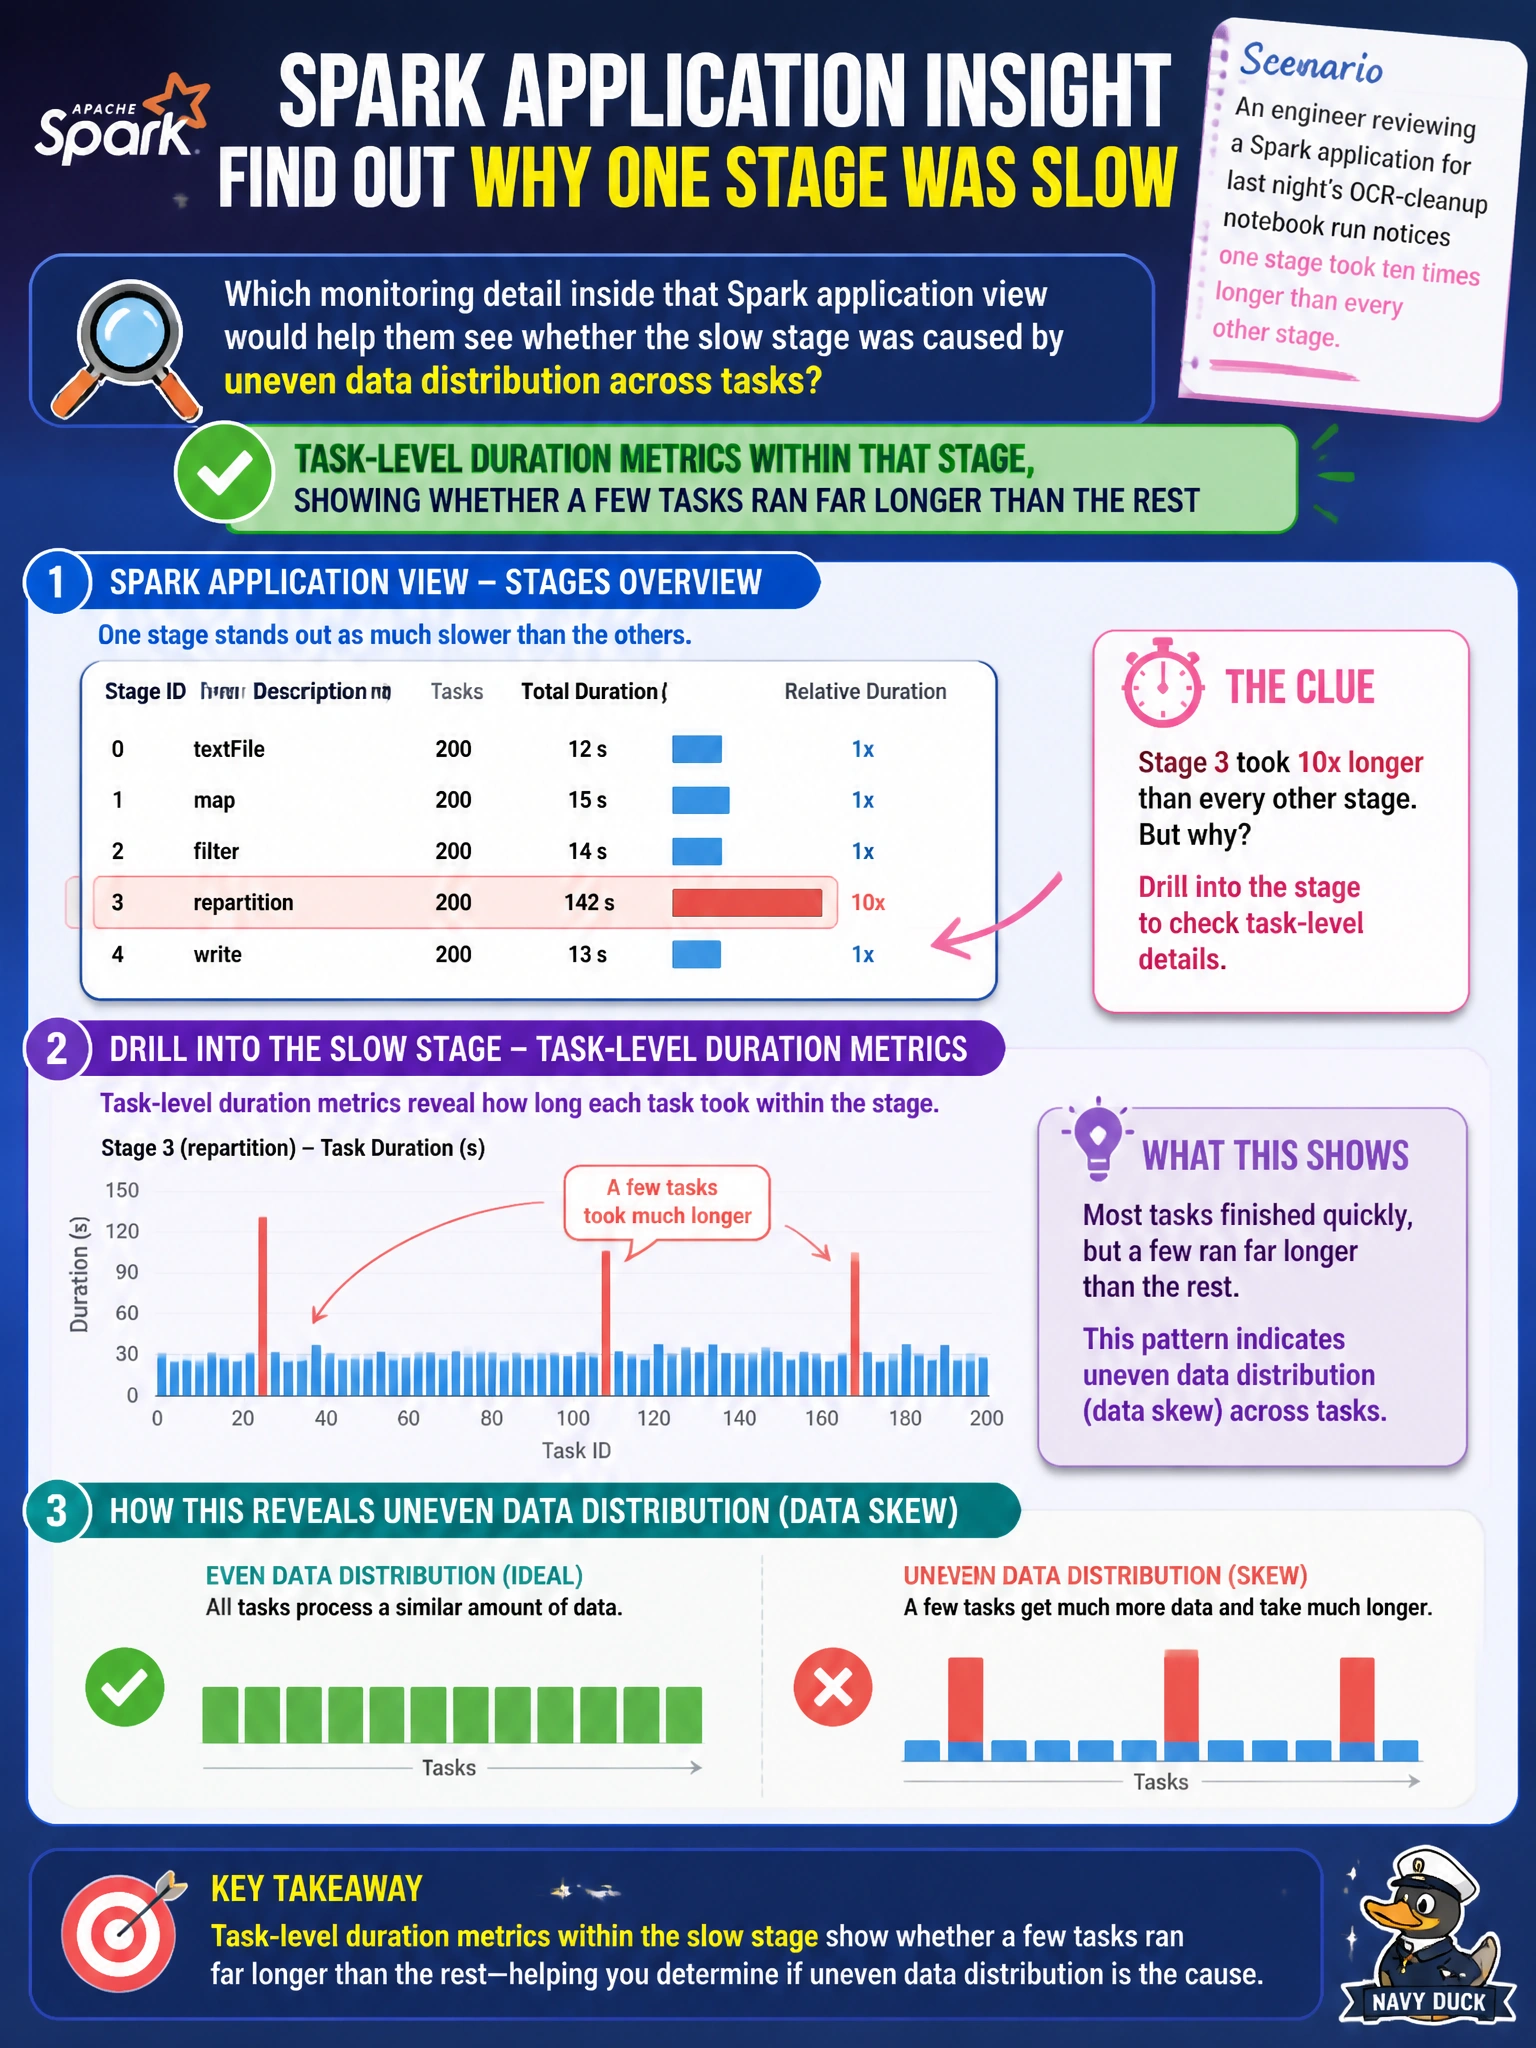
An engineer reviewing a Spark application for last night's OCR-cleanup notebook run notices one stage took ten times longer than every other stage. Which monitoring detail inside that Spark application view would help them see whether the slow stage was caused by uneven data distribution across tasks?
Select an answer to reveal the explanation.
Short Explanation
Comparing task durations inside one stage is like timing every runner on a relay team instead of just the team's total time. If one runner's leg is way longer than the rest, that's the skew showing up.
Full Explanation
Within a Spark application's detail view, drilling into a specific stage's task-level metrics shows the duration of each individual task that made up that stage, and a small number of tasks running far longer than the others is the classic signature of data skew, where one partition holds disproportionately more of the OCR data than the rest. The workspace's Git commit history tracks changes to the notebook's saved code over time; it has no runtime performance information about a particular Spark run. A semantic model's refresh history belongs to a different item type's own refresh attempts and durations, unrelated to this notebook's Spark execution. An Eventstream's data preview shows live event throughput for a streaming source, not batch Spark task metrics for a notebook run. If task duration is confirmed uneven, the next reasonable step is looking at how the OCR data is partitioned before that stage, since a better partitioning key often resolves the skew directly.