
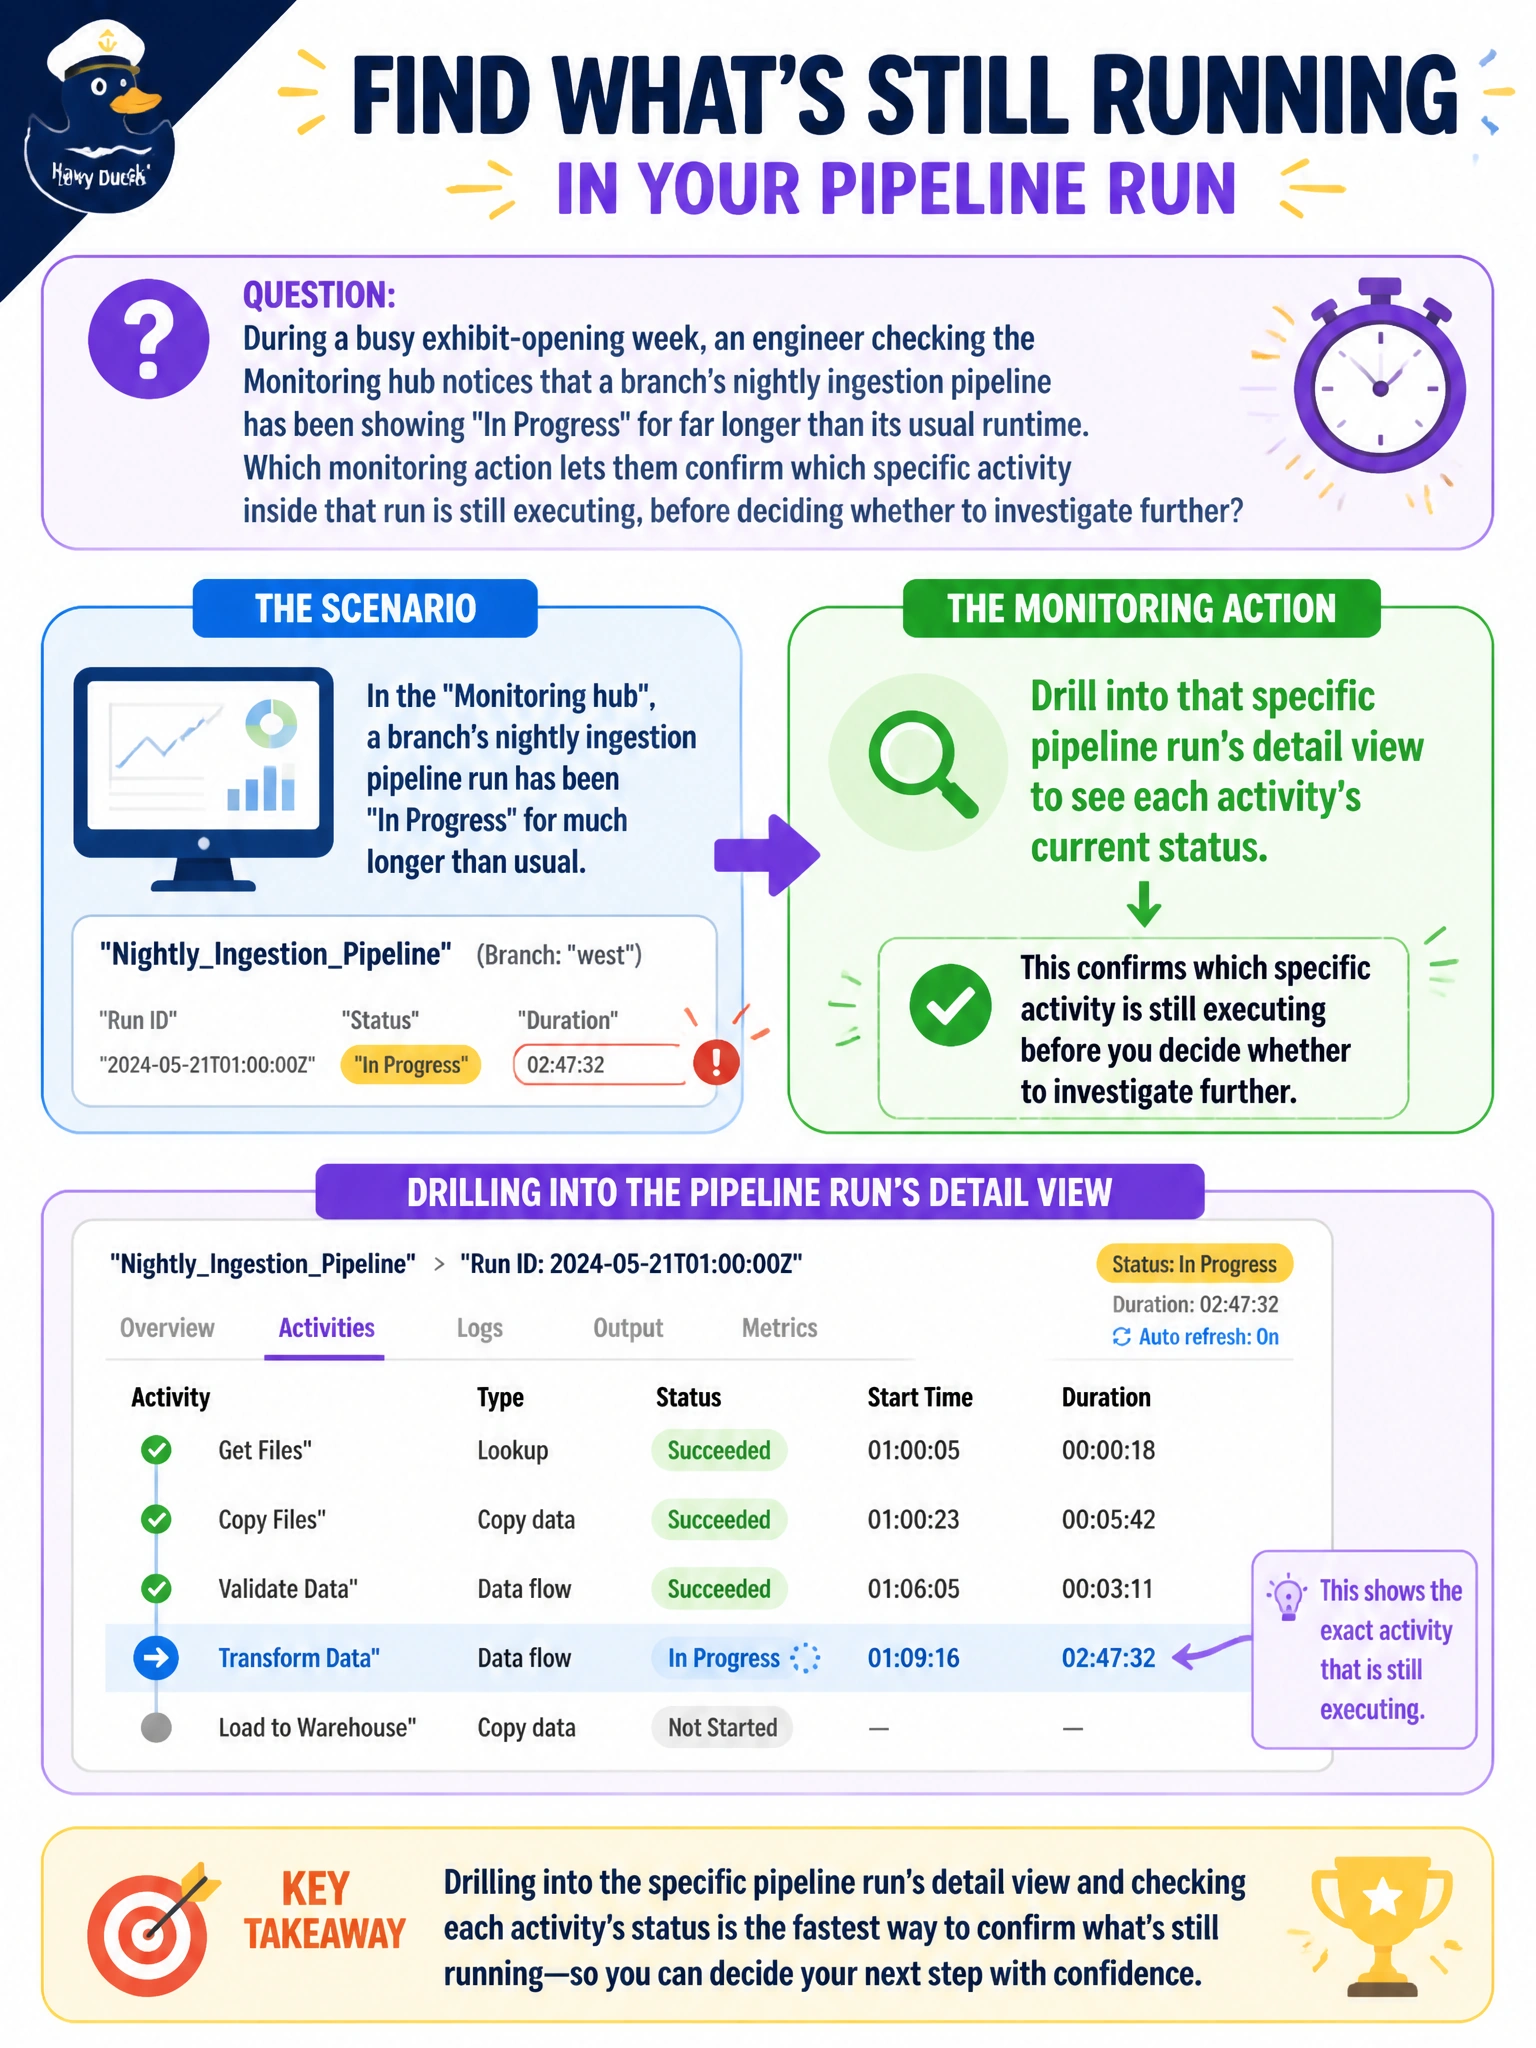
During a busy exhibit-opening week, an engineer checking the Monitoring hub notices that a branch's nightly ingestion pipeline has been showing "In Progress" for far longer than its usual runtime. Which monitoring action lets them confirm which specific activity inside that run is still executing, before deciding whether to investigate further?
Select an answer to reveal the explanation.
Short Explanation
Seeing "In Progress" on the overview is like seeing a train marked delayed on a departures board. Drilling into the run's detail view is walking to the platform to see which specific car is stuck.
Full Explanation
Drilling into a specific pipeline run from the Monitoring hub opens that run's detail view, which lists every activity in the run along with its individual current status, letting the engineer see exactly which activity is still executing rather than only knowing the overall run hasn't finished yet. A semantic model's refresh schedule governs when that separate item type refreshes and carries no information about a currently running pipeline. The workspace's sensitivity label report is a governance listing of classification labels applied to items, unrelated to run-time status of anything. The Capacity Metrics app's storage tab reports OneLake and warehouse storage consumption, not the live execution state of an individual pipeline run's activities. Once the stuck activity is identified, checking whether it's waiting on an external dependency, such as a source system, versus actively processing a large volume is the natural next distinction to make.