
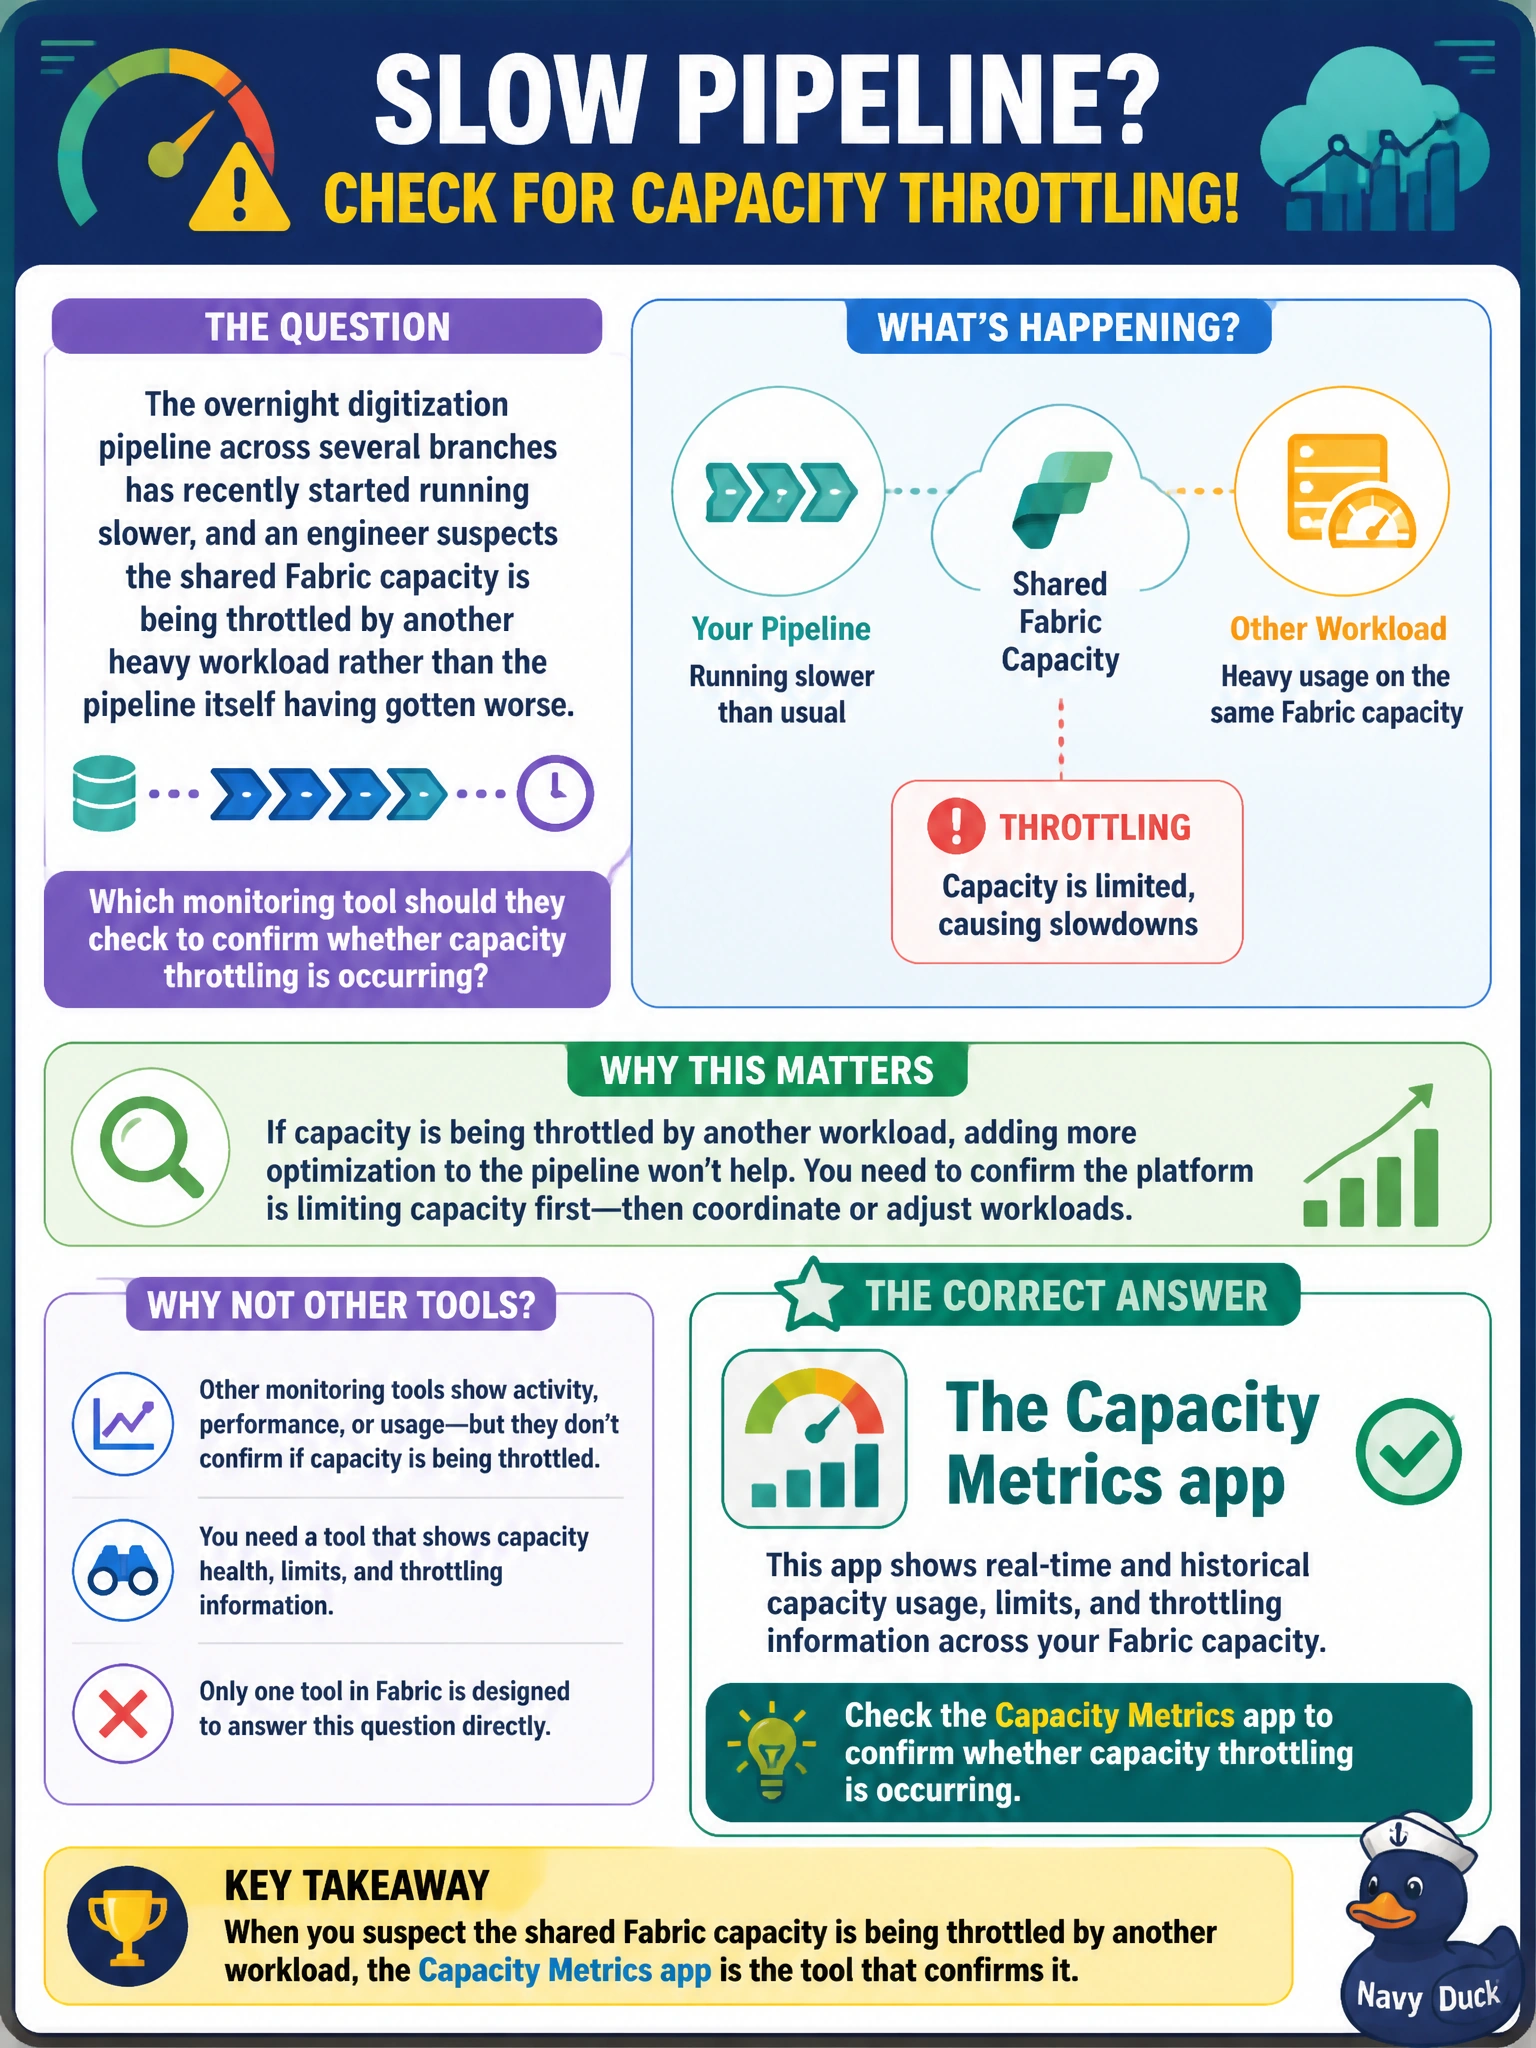
The overnight digitization pipeline across several branches has recently started running slower, and an engineer suspects the shared Fabric capacity is being throttled by another heavy workload rather than the pipeline itself having gotten worse. Which monitoring tool should they check to confirm whether capacity throttling is occurring?
Select an answer to reveal the explanation.
Short Explanation
The Capacity Metrics app is like a building's shared electrical panel meter: it shows how much of the total capacity every workload is drawing. That's how the engineer sees whether someone else tripped the breaker before blaming the pipeline itself.
Full Explanation
The Capacity Metrics app reports compute consumption, background operation usage, and throttling state for a Fabric capacity across every item and workspace assigned to it, which is exactly the view needed to determine whether a shared capacity is being overwhelmed by another workload and throttling the digitization pipeline's runs rather than the pipeline itself having regressed. The pipeline's own activity dependency diagram shows the logical order and conditions between its activities within one run; it has no awareness of capacity-wide resource contention from other items. A semantic model's refresh history is scoped to that model's own refresh attempts and durations, not to capacity-level consumption shared across many items. Item endorsement status only reflects whether an item has been certified or promoted for trust and discoverability, with no connection to performance or throttling. If the Capacity Metrics app shows sustained high utilization or throttling during the pipeline's run window, the next step is usually identifying which other item is consuming the capacity during that same window.