
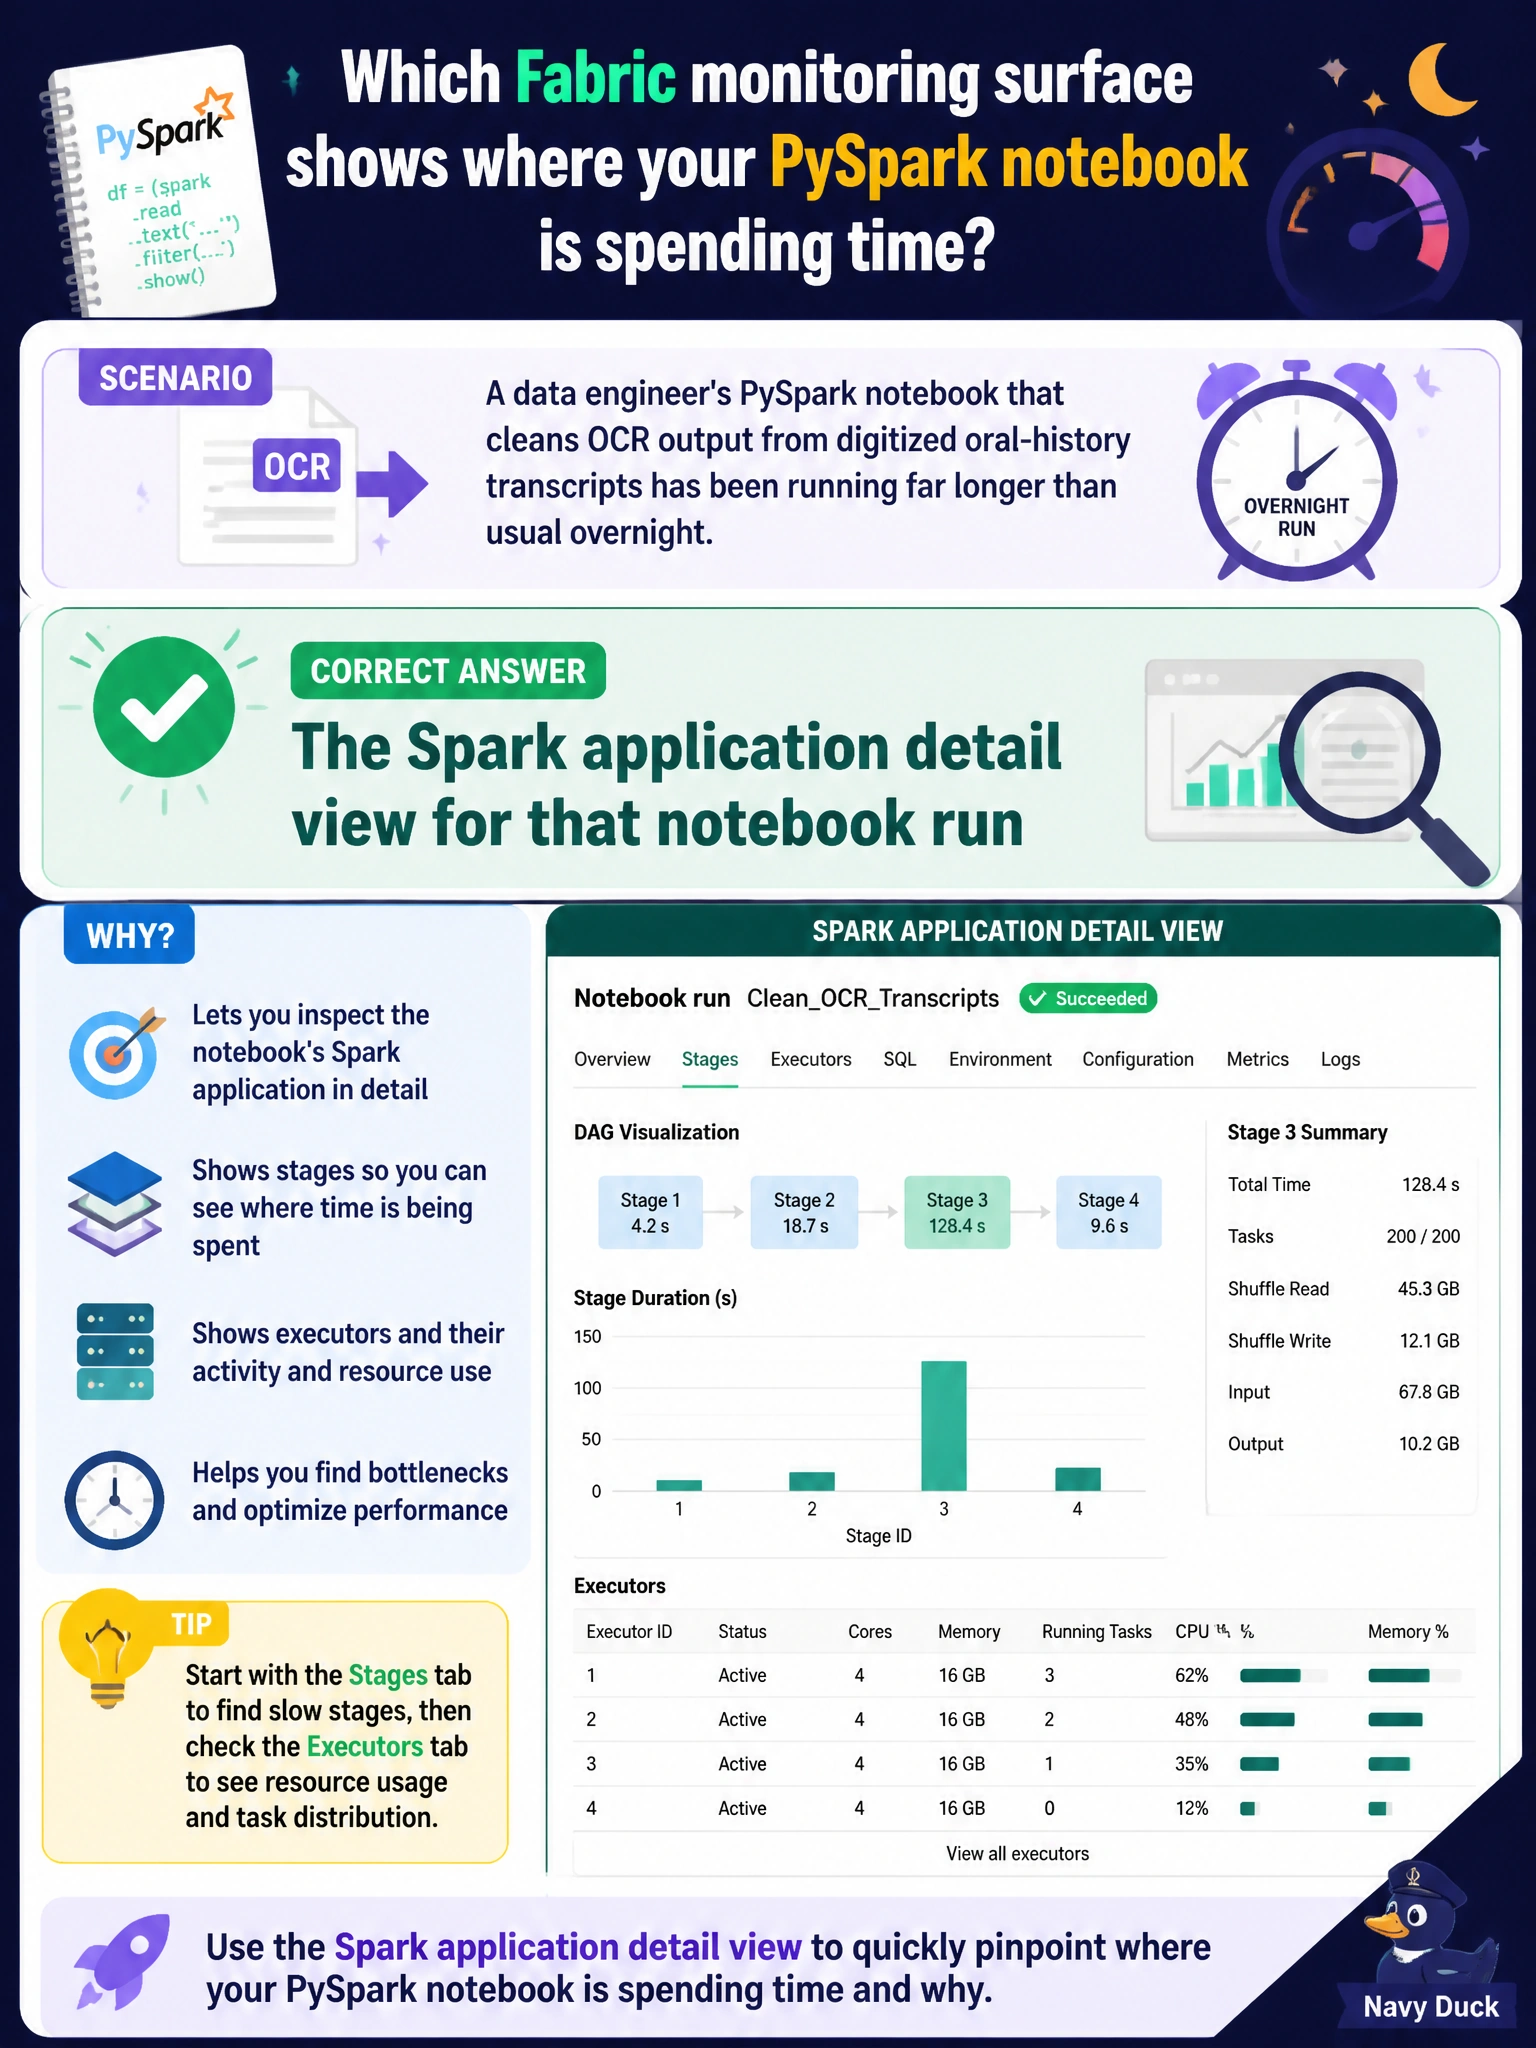
A data engineer's PySpark notebook that cleans OCR output from digitized oral-history transcripts has been running far longer than usual overnight. Which Fabric monitoring surface lets them inspect the notebook's Spark application, including its stages and executors, to see where time is being spent?
Select an answer to reveal the explanation.
Short Explanation
A Spark application's detail view is like popping the hood on the notebook's run: it breaks the job into stages and shows executor activity. That's what lets the engineer see which stage is dragging instead of staring at one long total runtime.
Full Explanation
Every notebook run in Fabric that executes on Spark produces a Spark application, and its detail view exposes the job's stages, tasks, and executor-level metrics, which is the right place to see whether the slowdown comes from data skew in one stage, executors sitting idle, spill to disk, or a shuffle-heavy step in the OCR cleanup logic. Dataflow Gen2 refresh history reports on a different item type's transformation runs entirely and would not contain any detail about a notebook's Spark execution. A sensitivity-label report is a governance artifact showing which items carry which classification labels; it has no runtime or performance information. The OneLake shortcut list simply enumerates configured shortcuts pointing at other data locations; it doesn't monitor execution of any kind. Once inside the Spark application view, checking whether one stage's task durations are wildly uneven versus the others is a fast way to tell data skew from a genuine compute bottleneck.