
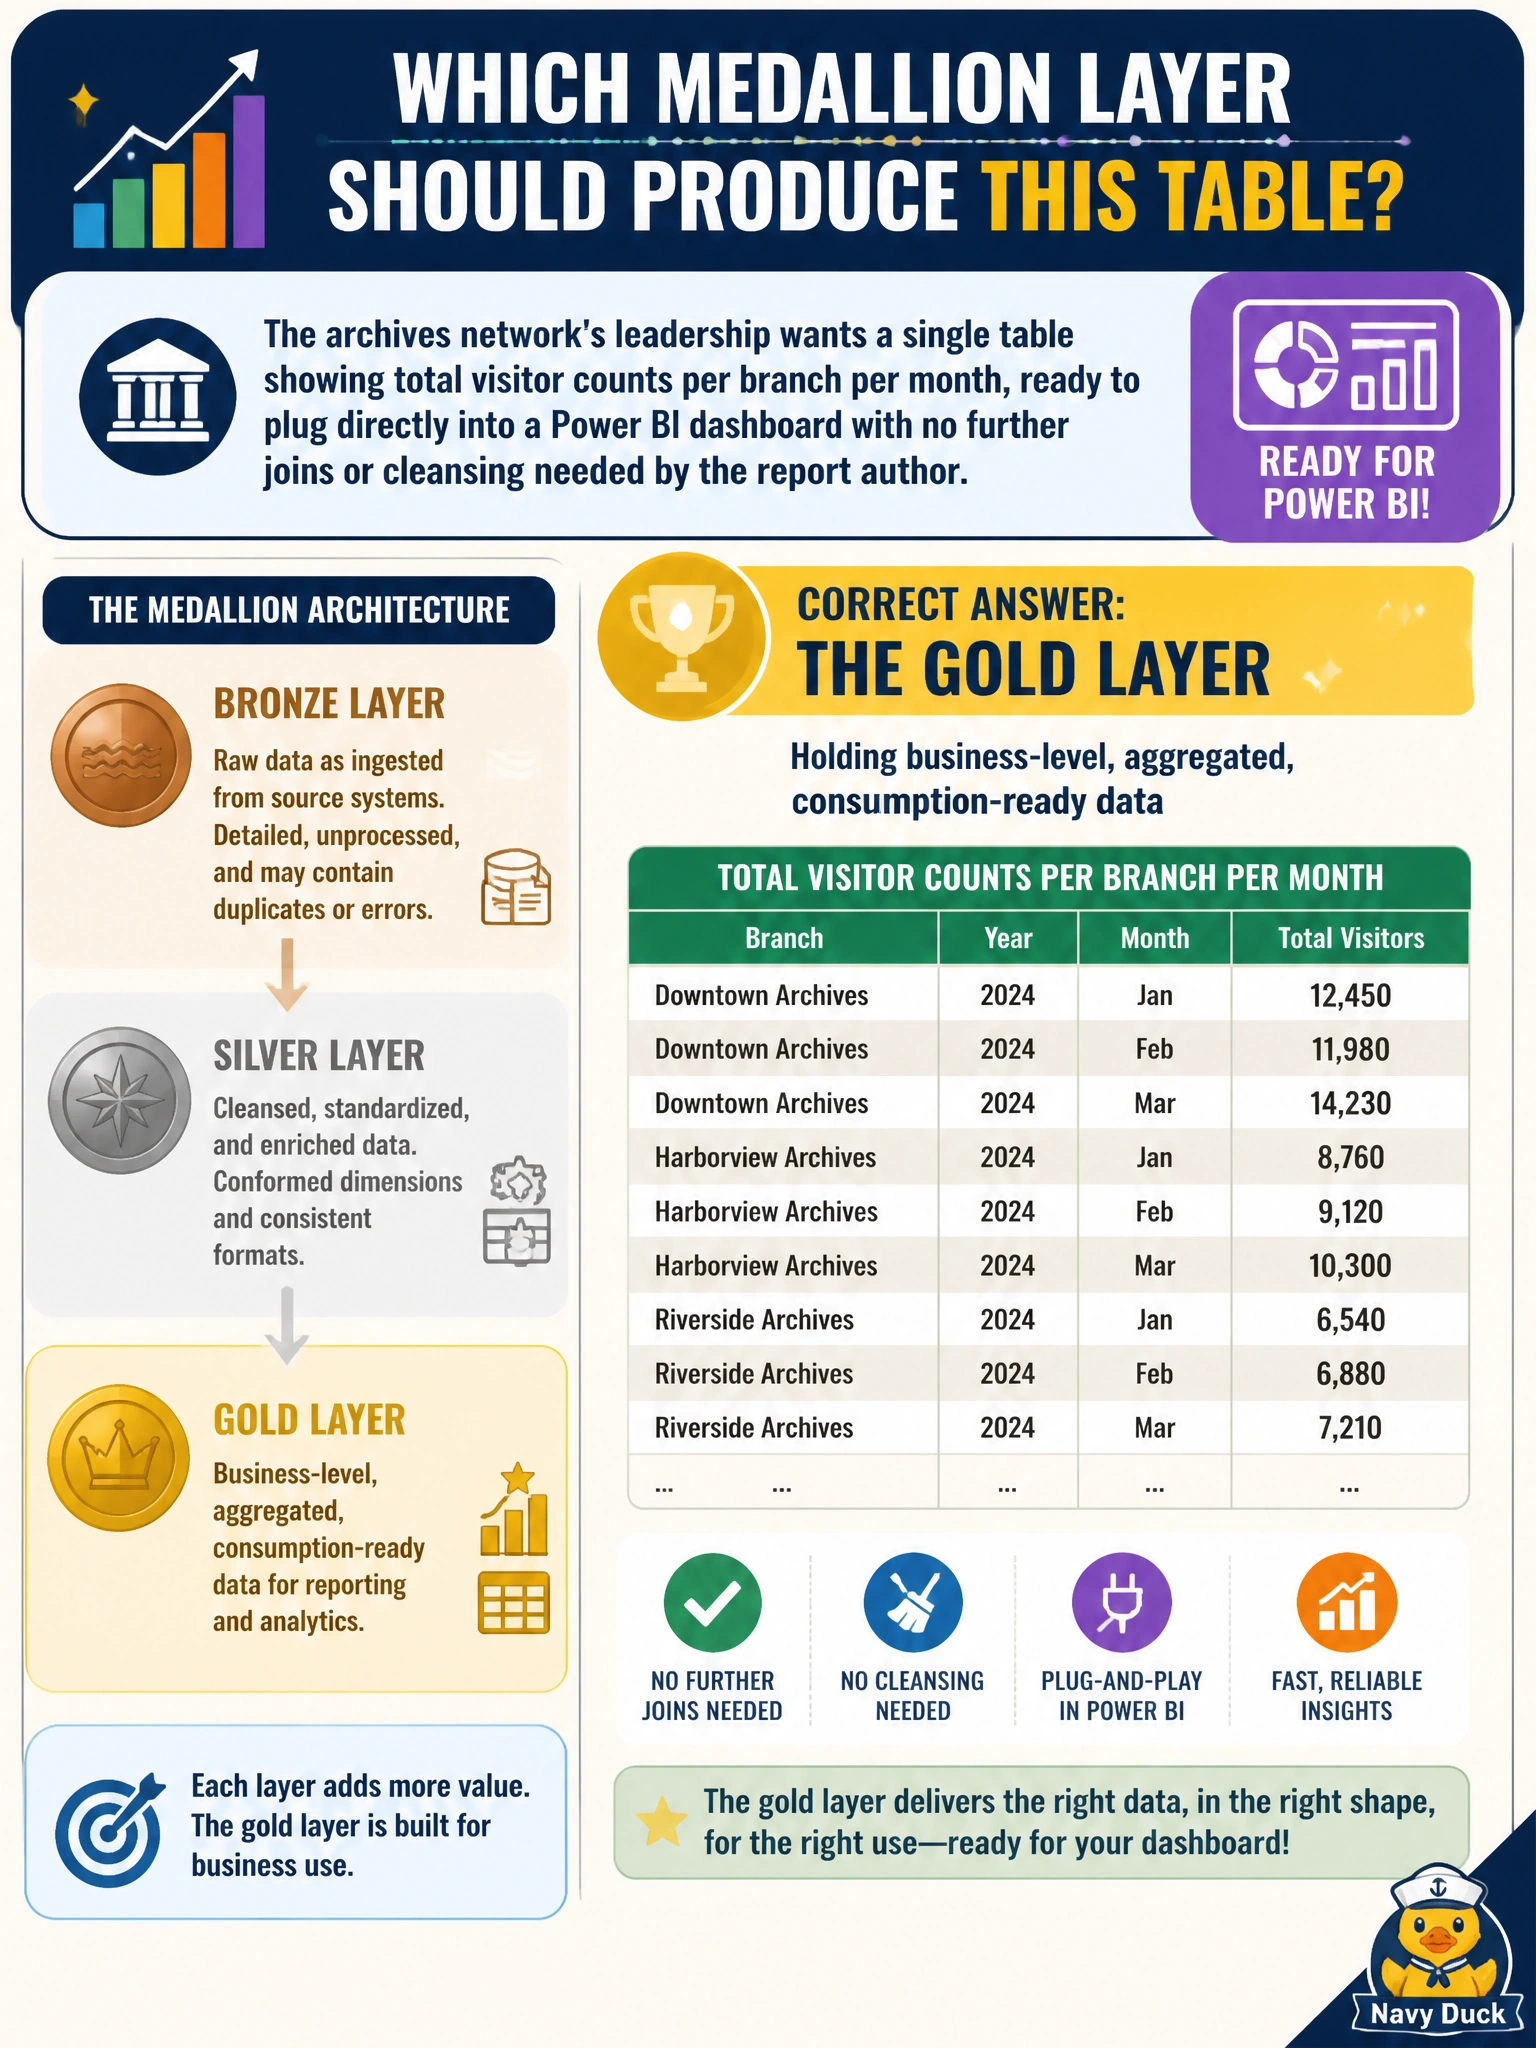
The archives network's leadership wants a single table showing total visitor counts per branch per month, ready to plug directly into a Power BI dashboard with no further joins or cleansing needed by the report author. Which medallion layer should produce this table?
Select an answer to reveal the explanation.
Short Explanation
This is the finished exhibit, not the raw crate or the workbench. The gold layer is built for exactly this: aggregated, business-shaped tables a report author can drop straight into a dashboard.
Full Explanation
The gold layer is the final stage of a medallion architecture, purpose-built to hold business-level, aggregated data shaped for direct consumption, such as a monthly visitor-count table with no further joins or cleansing required by the report author. Producing pre-aggregated, report-ready tables is exactly gold's role. The bronze layer holds raw, unmodified source data and has not been aggregated, deduplicated, or validated at all, so it cannot serve as a monthly summary ready for a dashboard. The silver layer conforms and cleanses data across sources but typically still represents data at a detailed, transactional grain rather than pre-aggregated by month and branch; treating silver as dashboard-ready skips the aggregation step that gold exists to perform, and it pushes join and rollup logic onto every report instead of doing it once upstream. A OneLake shortcut pointing at the visitor-ticketing source system reintroduces a live dependency on the operational system and provides no aggregation or business shaping at all, which is the opposite of what a ready-to-consume table needs. Before shipping the gold table, confirm the aggregation grain, one row per branch per month here, matches exactly what the dashboard expects, since a mismatched grain forces the report author right back into doing joins gold was supposed to eliminate.