
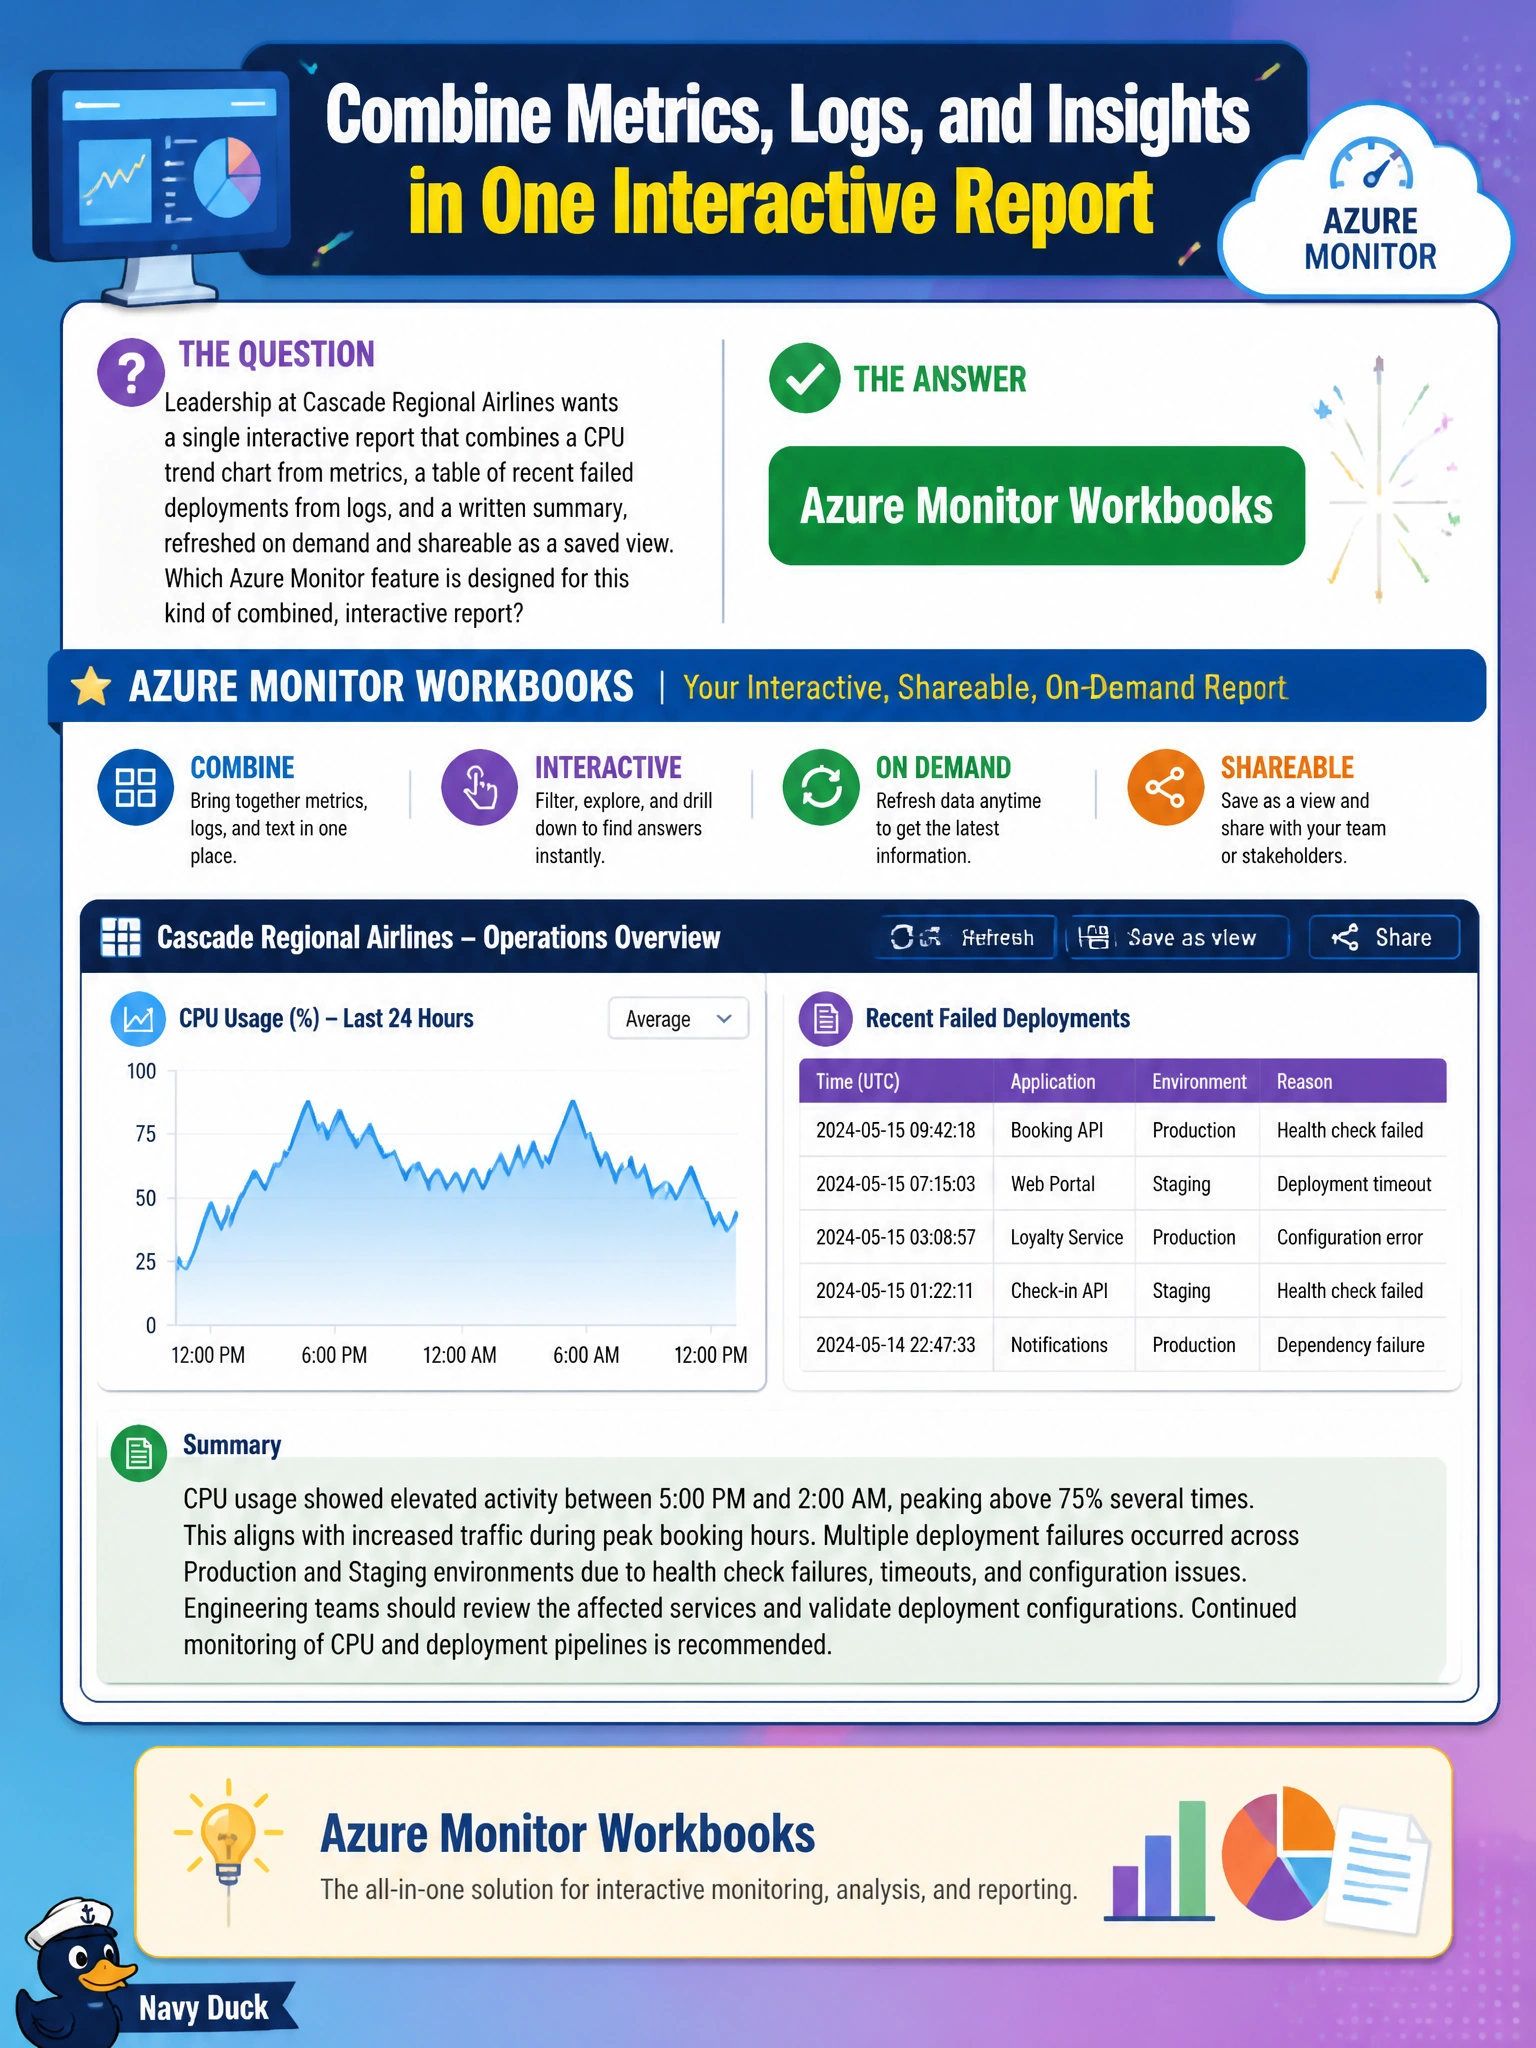
Leadership at Cascade Regional Airlines wants a single interactive report that combines a CPU trend chart from metrics, a table of recent failed deployments from logs, and a written summary, refreshed on demand and shareable as a saved view. Which Azure Monitor feature is designed for this kind of combined, interactive report?
Select an answer to reveal the explanation.
Short Explanation
A workbook is like a scrapbook page that can pull in a chart here, a table there, and a note in between, all on one interactive canvas that updates when you refresh it, instead of forcing you to flip between separate tools.
Full Explanation
Azure Monitor Workbooks combine data from multiple sources, including metrics, log queries, and static text, into a single interactive canvas with parameters, charts, and tables, and the finished workbook can be saved and shared as a reusable template, which matches the requirement for one combined, on-demand report. A metric alert is a detection and notification mechanism, not a reporting canvas, and has no facility for embedding log tables or narrative text alongside a chart. Exporting the activity log produces a raw record of control-plane events, not an interactive, mixed-source report, and it would not include deployment logs or CPU trend visualizations in one place. There is no such thing as a backup policy report in Azure Monitor; backup policies belong to Azure Backup and govern retention and scheduling, not reporting. To validate a workbook meets the requirement, an engineer should confirm each pinned element pulls live data on refresh and that the saved workbook opens correctly for another user with appropriate permissions.