
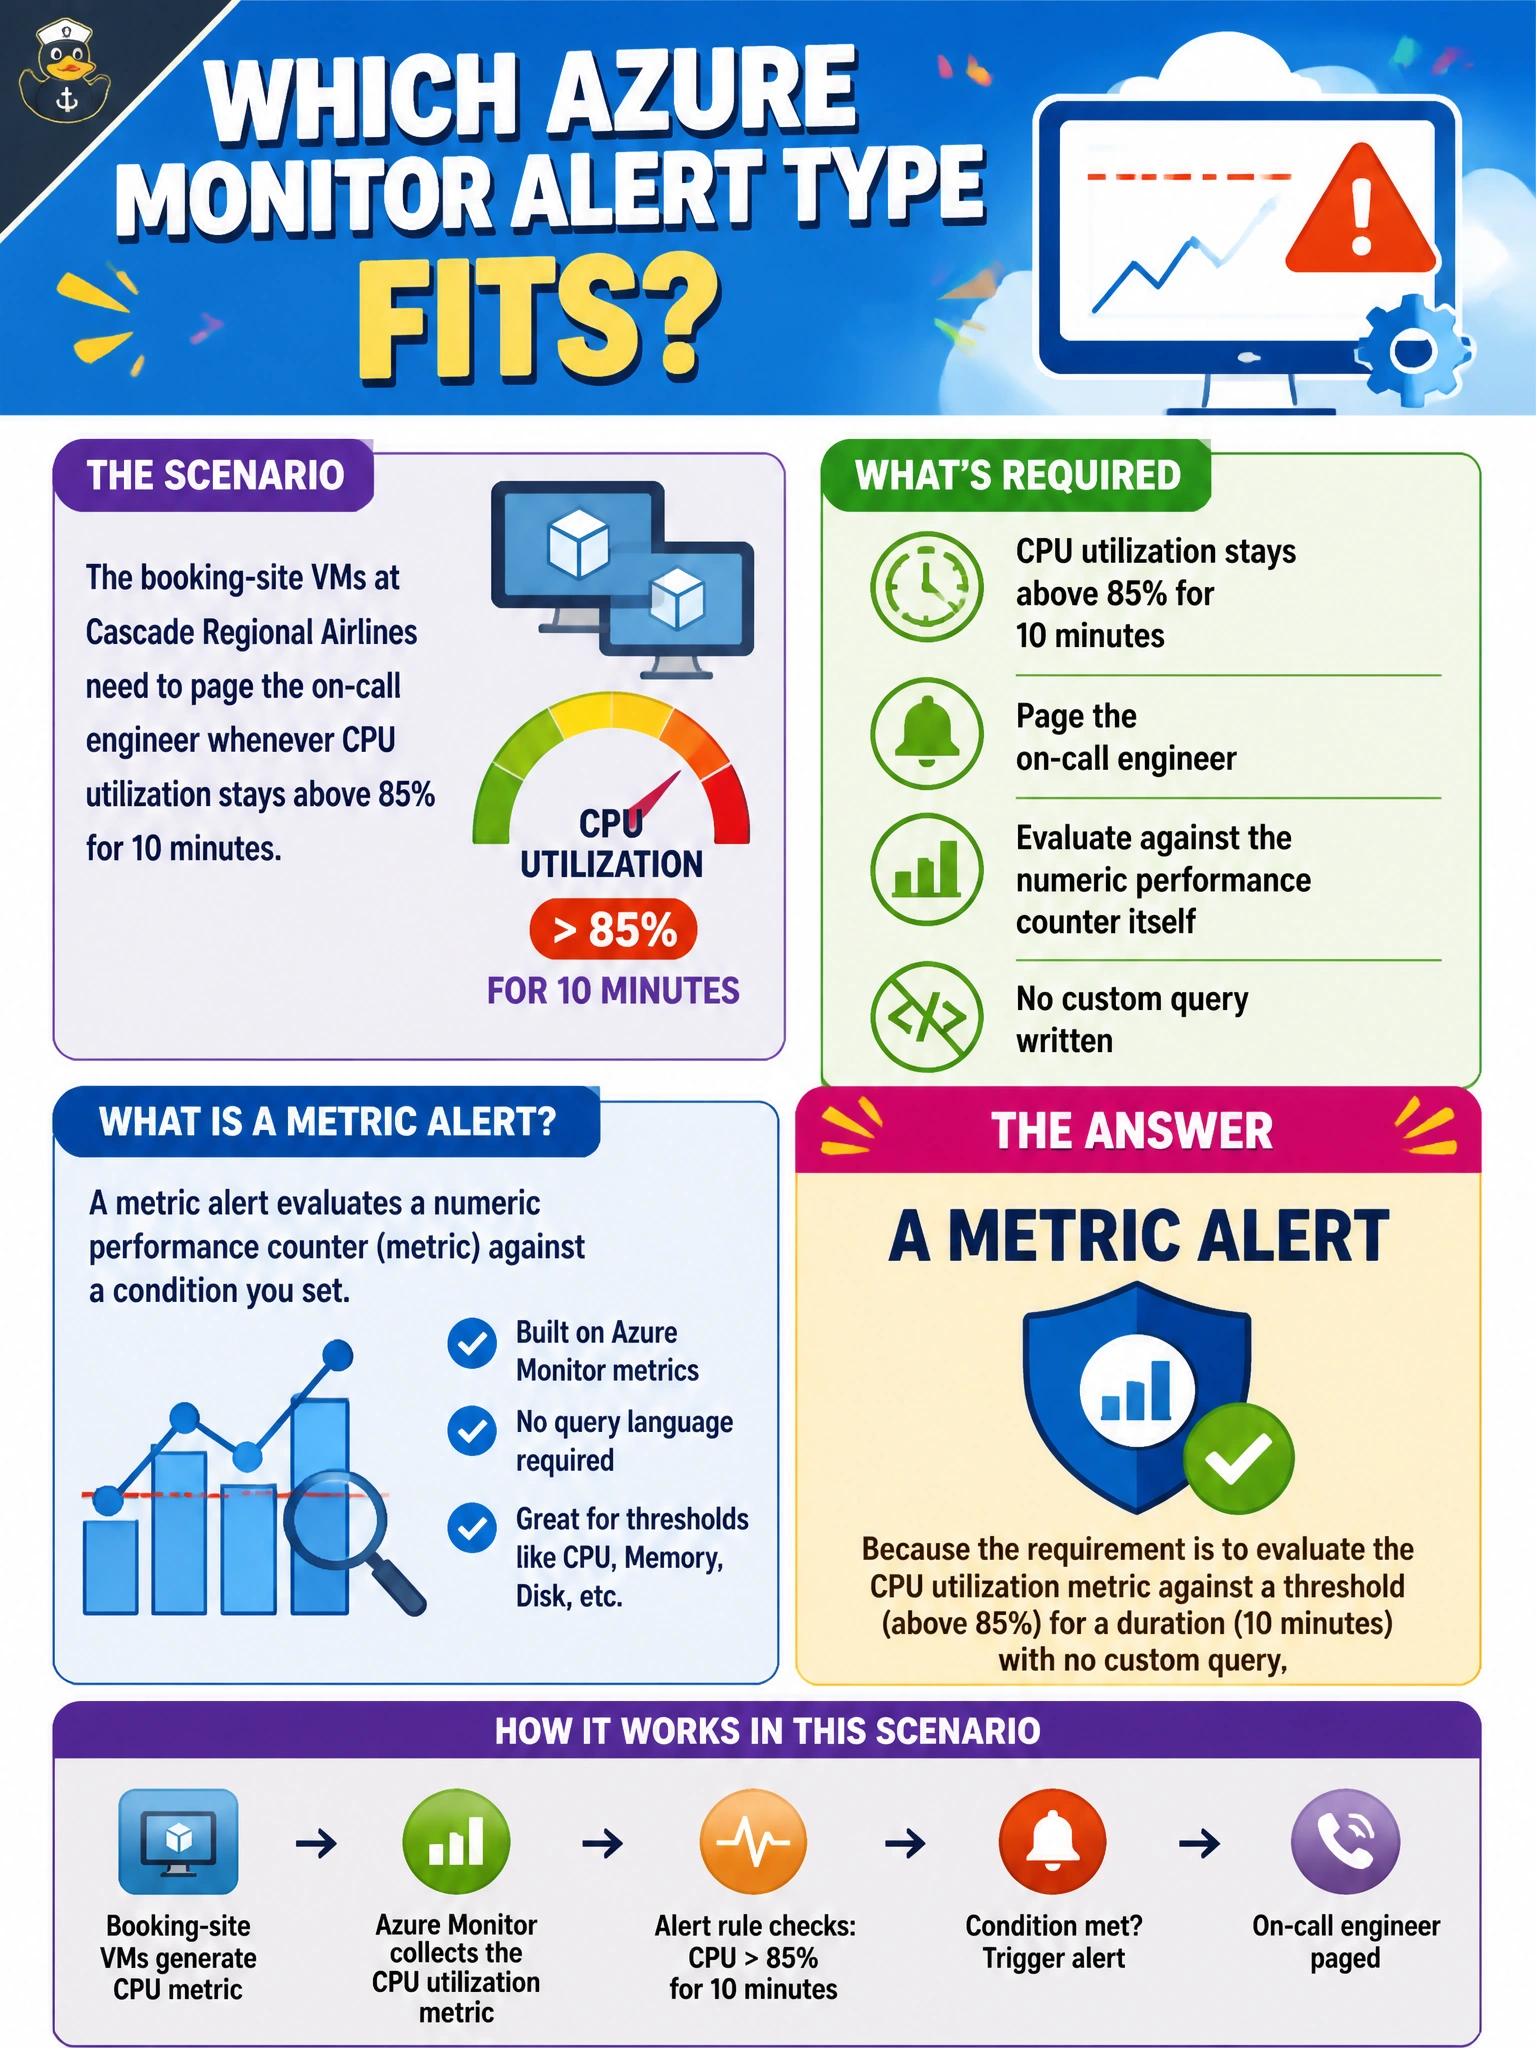
The booking-site VMs at Cascade Regional Airlines need to page the on-call engineer whenever CPU utilization stays above 85% for 10 minutes. The team wants this evaluated against the numeric performance counter itself, with no custom query written. Which Azure Monitor alert type fits?
Select an answer to reveal the explanation.
Short Explanation
This is the classic thermostat scenario: watch one number, and if it crosses a line for long enough, sound the alarm. A metric alert does exactly that against the CPU counter directly, no query language required.
Full Explanation
A metric alert evaluates a numeric metric, such as Percentage CPU, directly against a threshold and a time window, and it is the right tool whenever the condition can be expressed as this counter crosses this value for this duration without needing to correlate or filter structured log records. It is also typically the fastest-evaluating alert type, checking on a short cadence, which suits urgent operational thresholds like sustained high CPU. An activity log alert only fires on control-plane events recorded in the subscription's activity log, such as a resource being deleted or a role assignment changing, and has no concept of a runtime performance counter. A scheduled query rule, commonly called a log alert, runs a Kusto query against a Log Analytics workspace on a schedule and is the right choice when the condition requires filtering, joining, or aggregating structured log data, which is unnecessary overhead for a straightforward metric threshold. An alert processing rule does not detect conditions at all; it only modifies how already-triggered alerts are routed, suppressed, or grouped. To validate the metric alert is working, check its fired-alerts history after deliberately spiking CPU load on a test VM.