
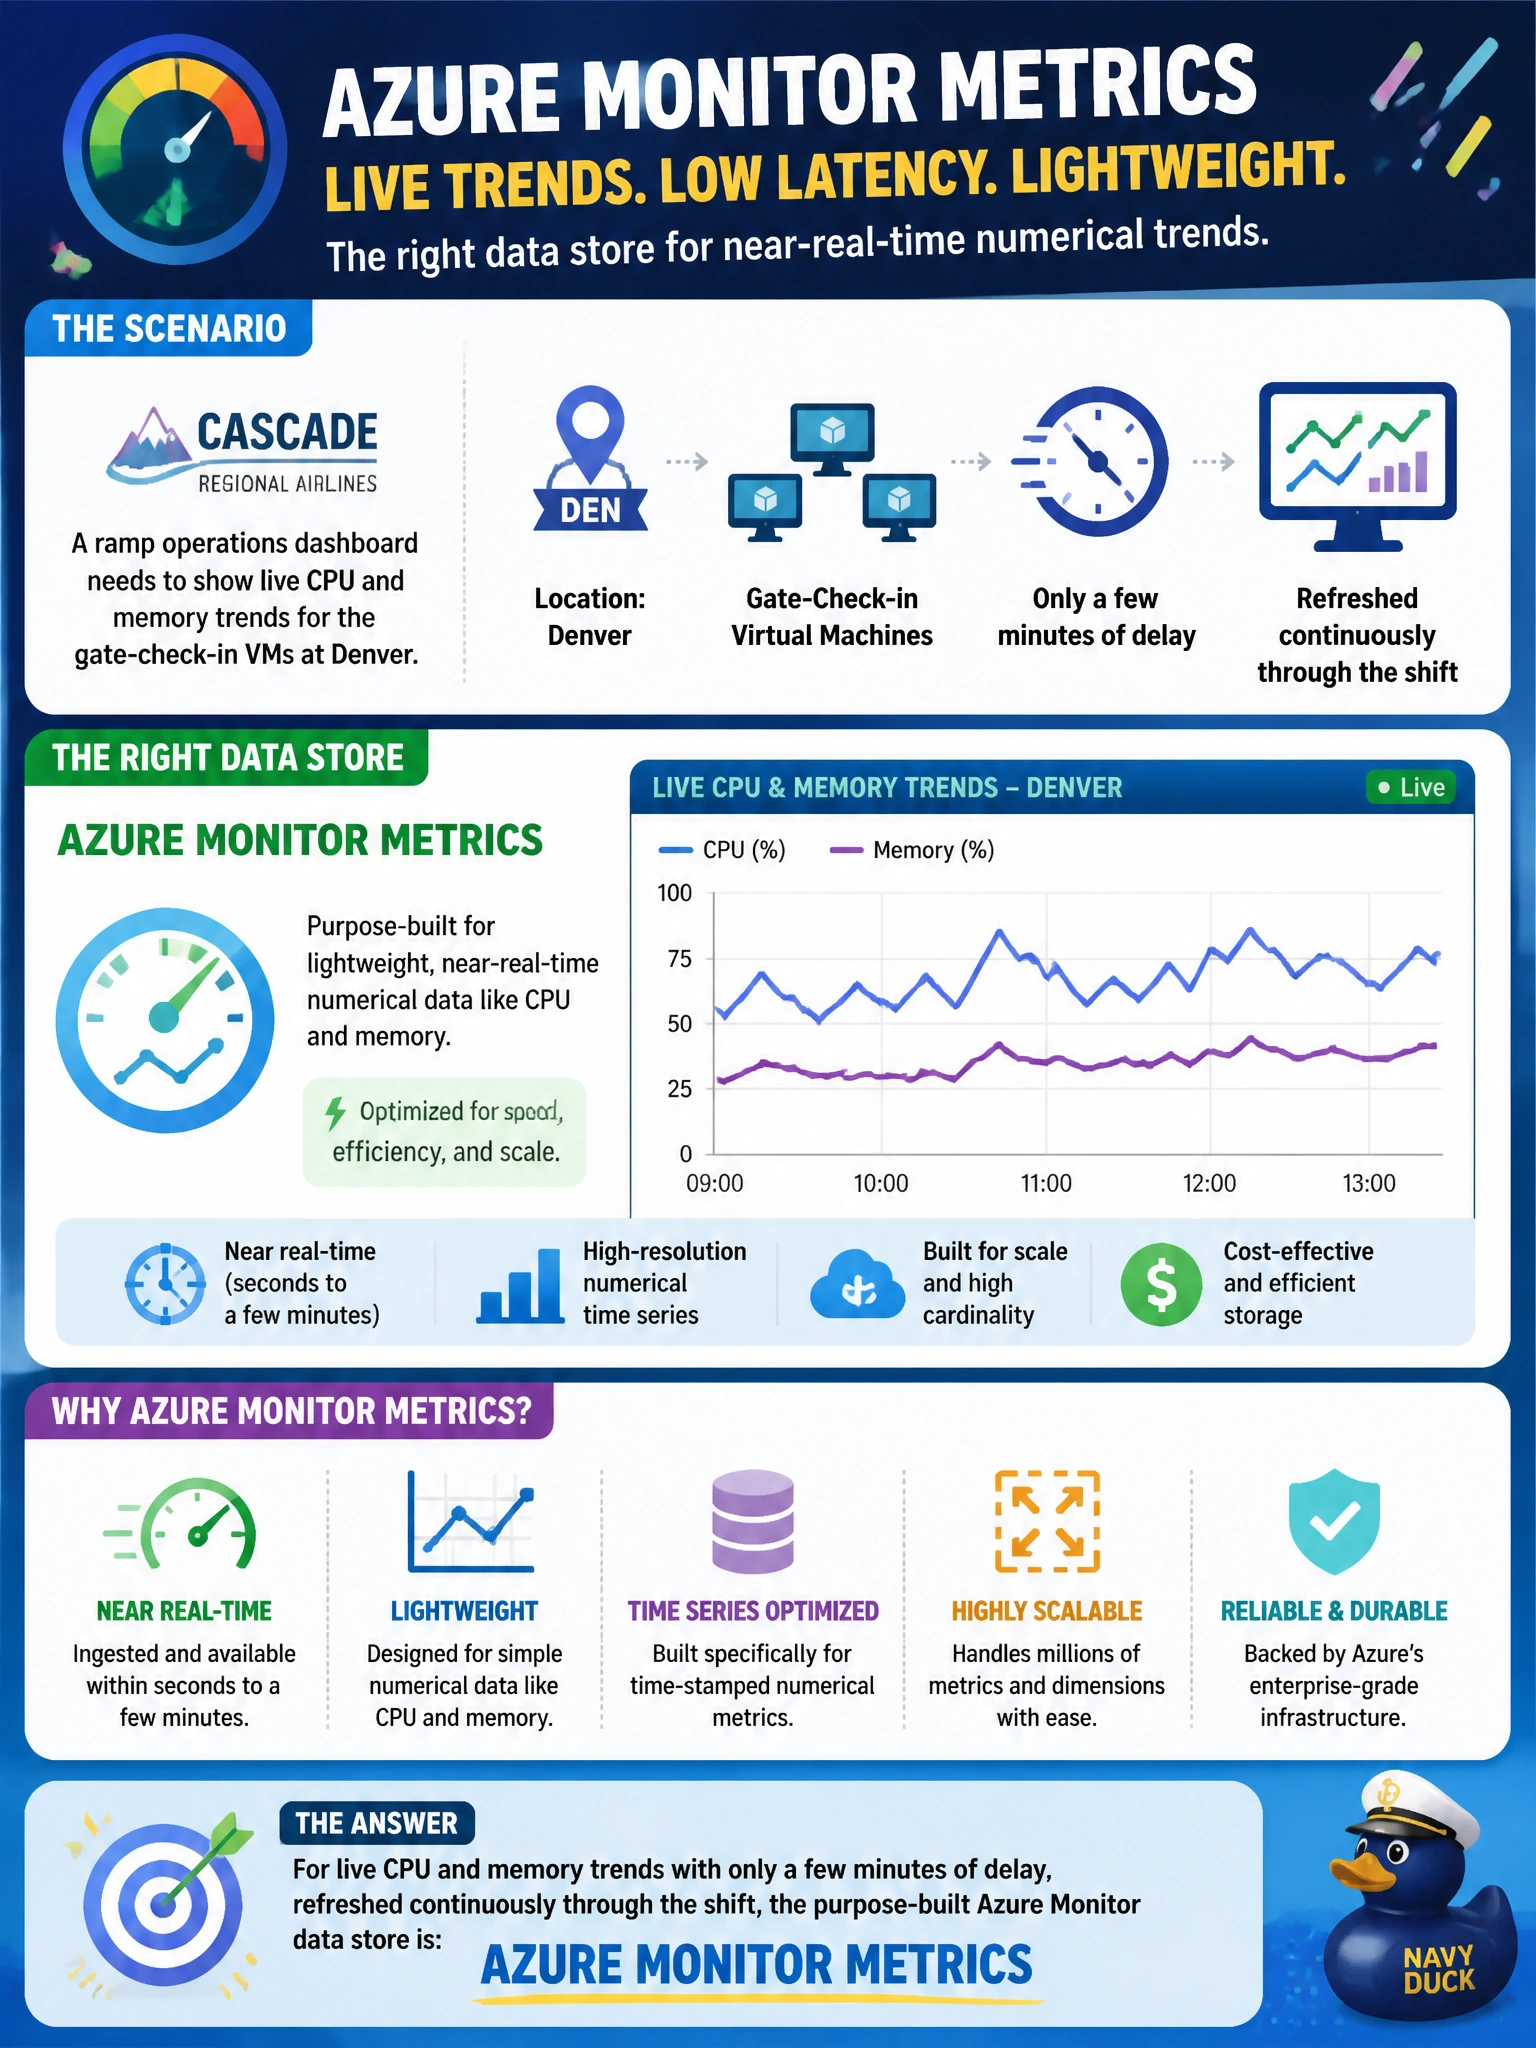
At Cascade Regional Airlines, a ramp operations dashboard needs to show live CPU and memory trends for the gate-check-in VMs at Denver with only a few minutes of delay, refreshed continuously through the shift. Which Azure Monitor data store is purpose-built for this kind of lightweight, near-real-time numerical trend?
Select an answer to reveal the explanation.
Short Explanation
Think of metrics like a heart-rate monitor: a steady stream of numbers sampled fast and cheap. Azure Monitor Metrics stores numeric time-series data in a way built for near-real-time charts, so a dashboard can refresh every minute without running a search over huge log tables.
Full Explanation
Azure Monitor Metrics is a lightweight, time-series database optimized for numeric values like CPU percentage and available memory, collected at short, regular intervals and retained natively for a fixed window. Because the data is pre-indexed by time and resource, dashboards and near-real-time alerts against it are fast and inexpensive compared to running a query. A Log Analytics workspace stores rich structured records (including custom logs) and answers deep questions with Kusto Query Language, but even a fast query still has to execute and typically lags real numeric sampling by more than metrics do, and it costs more per data point at high frequency. The activity log only records control-plane operations against Azure Resource Manager, such as who created or modified a resource, not runtime performance counters, so it cannot answer a CPU trend question at all. A diagnostic settings export to storage is for long-term retention and offline analysis, not for live dashboards, since data lands there in batches rather than being queried interactively. To confirm this is set up correctly, check the resource's Metrics blade and verify the aggregation interval matches what the dashboard needs.