
A support team notices that a Foundry-hosted chatbot occasionally takes far longer than usual to respond, but the issue happens unpredictably and is hard to reproduce on demand. To investigate, an engineer connects the deployment's monitoring integration and reviews traces showing the timing of each internal step, retrieval, model inference and post-processing, for individual past requests. What is the main benefit of reviewing these per-request traces rather than only looking at an aggregate average response time metric?
Select an answer to reveal the explanation.
Short Explanation
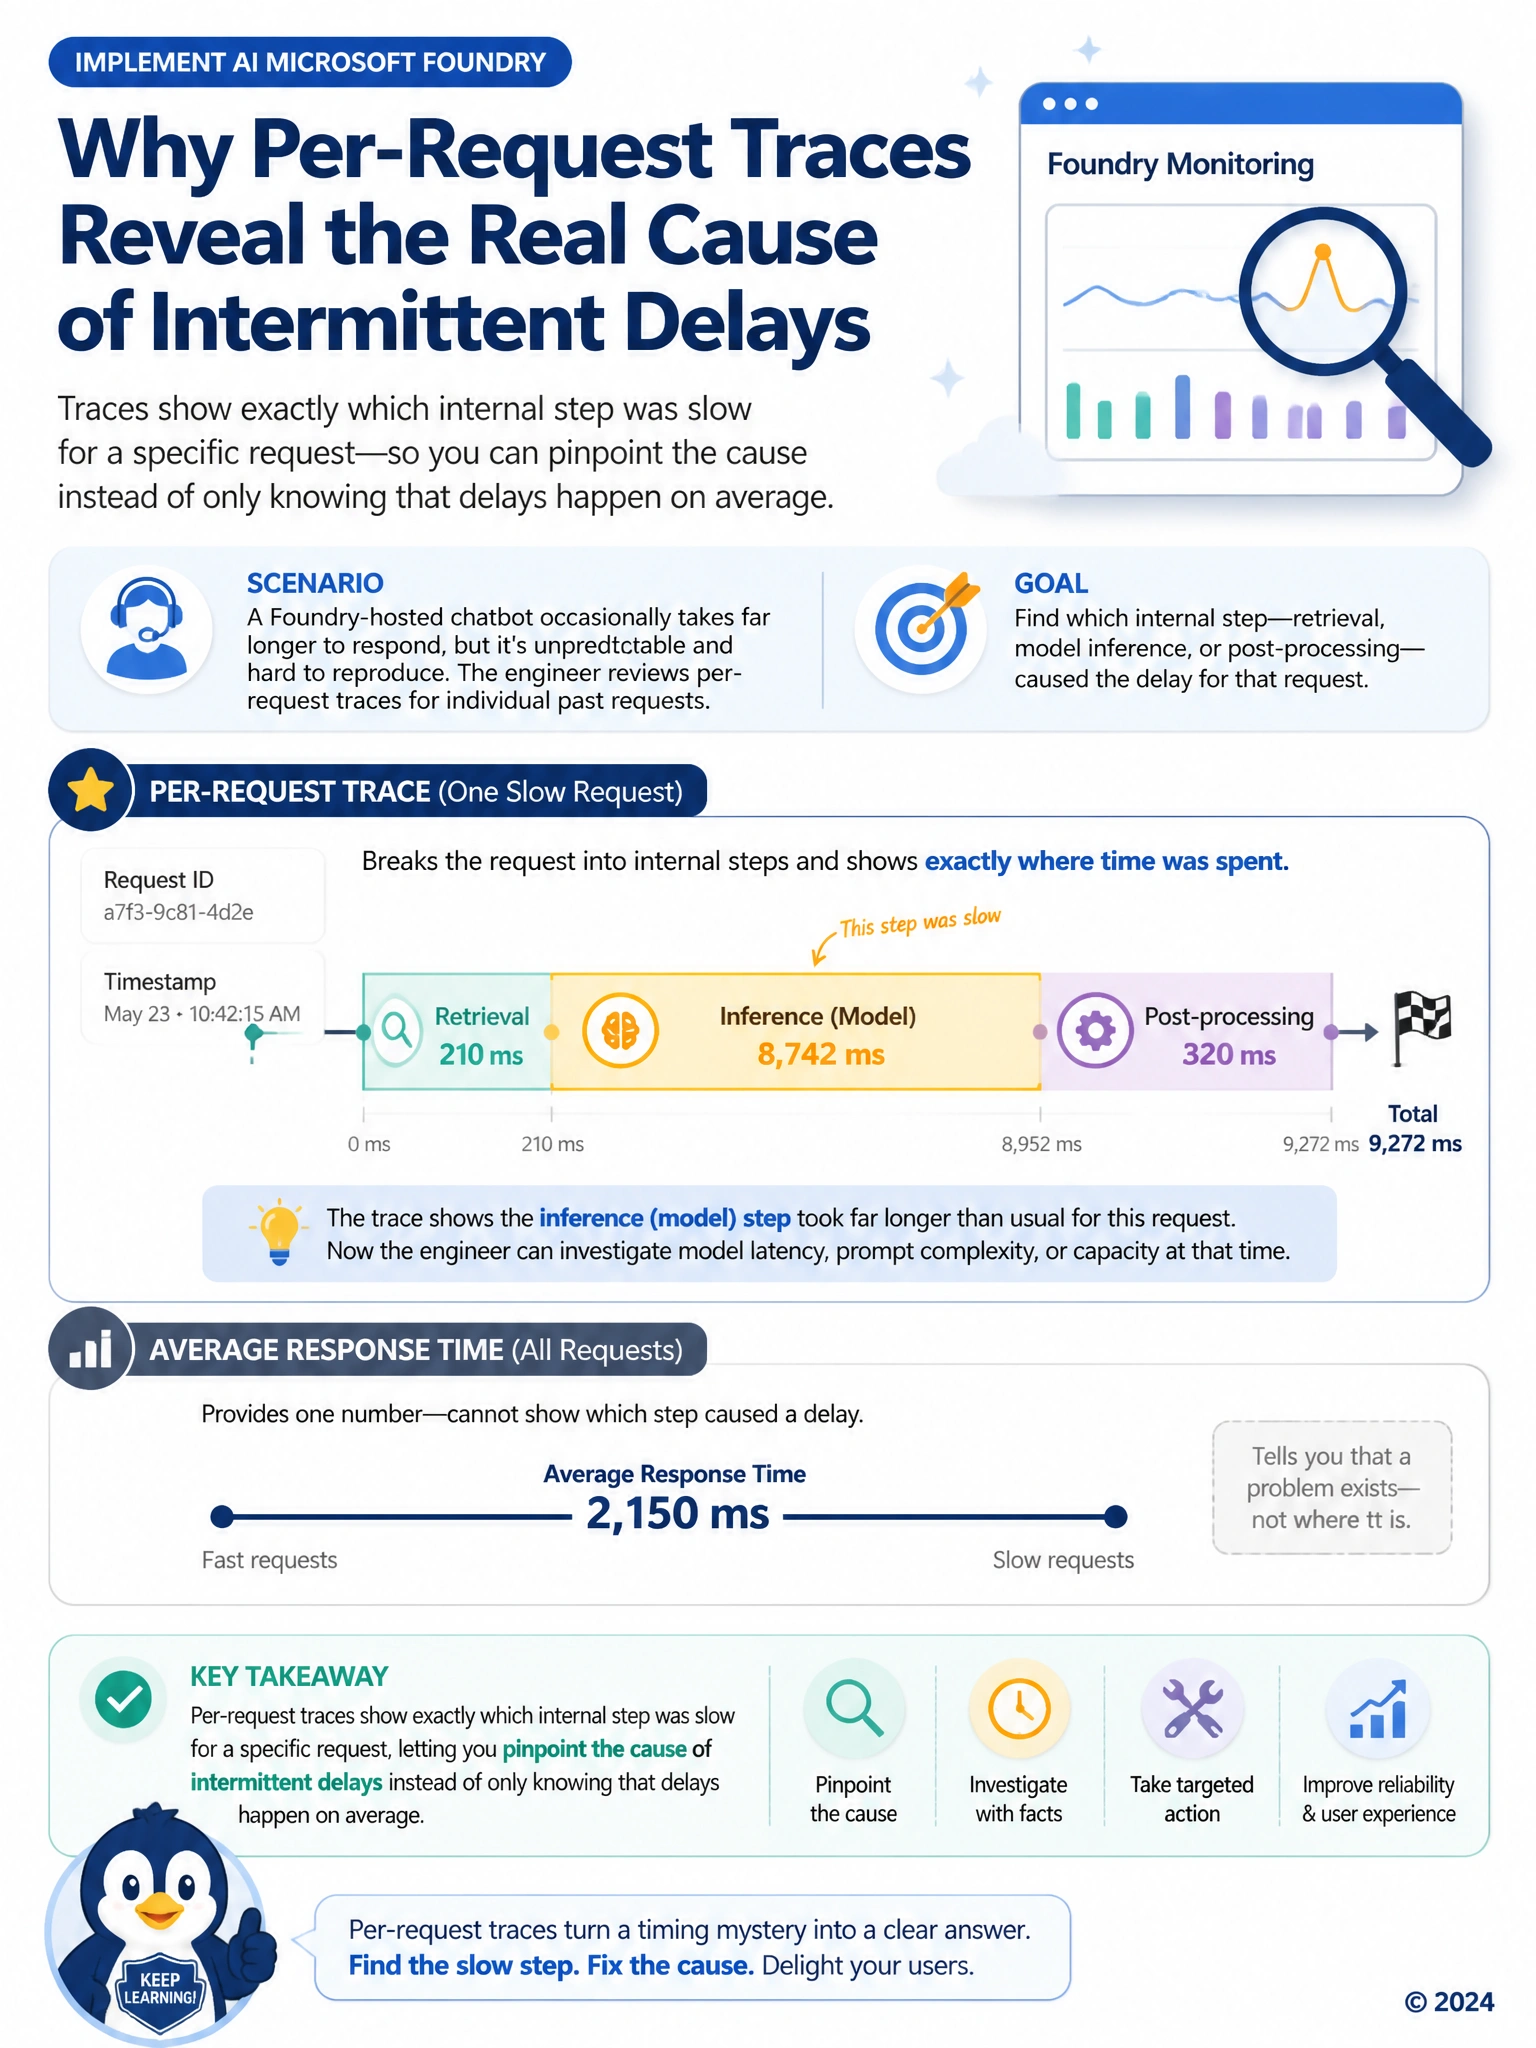
An overall average is really good at telling someone that a problem exists somewhere, and really bad at telling them where. That is the whole reason the engineer went digging into per-request traces instead of stopping at the average: breaking one slow request down into its individual steps, the retrieval part, the model's own thinking time, the cleanup afterward, shows exactly which piece stalled that particular time, which is the only way to chase something that will not reproduce on command. These traces are not some automatic fix that quietly reroutes slow requests to a faster model on its own, someone still has to act on what they find. They also are not standing in for content safety review, that is a completely separate job focused on what gets blocked, not on how long anything took. And while billing naturally tracks usage somewhere, that is not what these traces are for here, the engineer is chasing a timing mystery, not a token count.
Full Explanation
The correct answer is A. An aggregate average response time only tells the engineer that delays are happening somewhere across many requests, but it hides exactly where the slowdown occurs, whereas per-request traces break a single request down into its internal steps, retrieval, inference and post-processing, so the engineer can see that, for example, retrieval time spiked for a particular slow request while inference stayed normal, which is precisely the detail needed to chase down an intermittent, hard-to-reproduce issue. Option B is incorrect because traces are a diagnostic and observability tool, they display what happened during a request but do not take corrective action like retrying with a different model on their own. Option C is incorrect because tracing and content safety filtering are separate systems, traces record timing and execution details, they are not a substitute for the filtering that evaluates whether content should be blocked. Option D is incorrect because while usage and billing data may be tracked elsewhere in monitoring, traces are not the exclusive or primary source for total token counts, and that is not the reason the engineer is reviewing them here, the goal is diagnosing latency.