
AI workers consume Service Bus jobs for inspections. Which OpenTelemetry metrics help ops most?
Select an answer to reveal the explanation.
Short Explanation
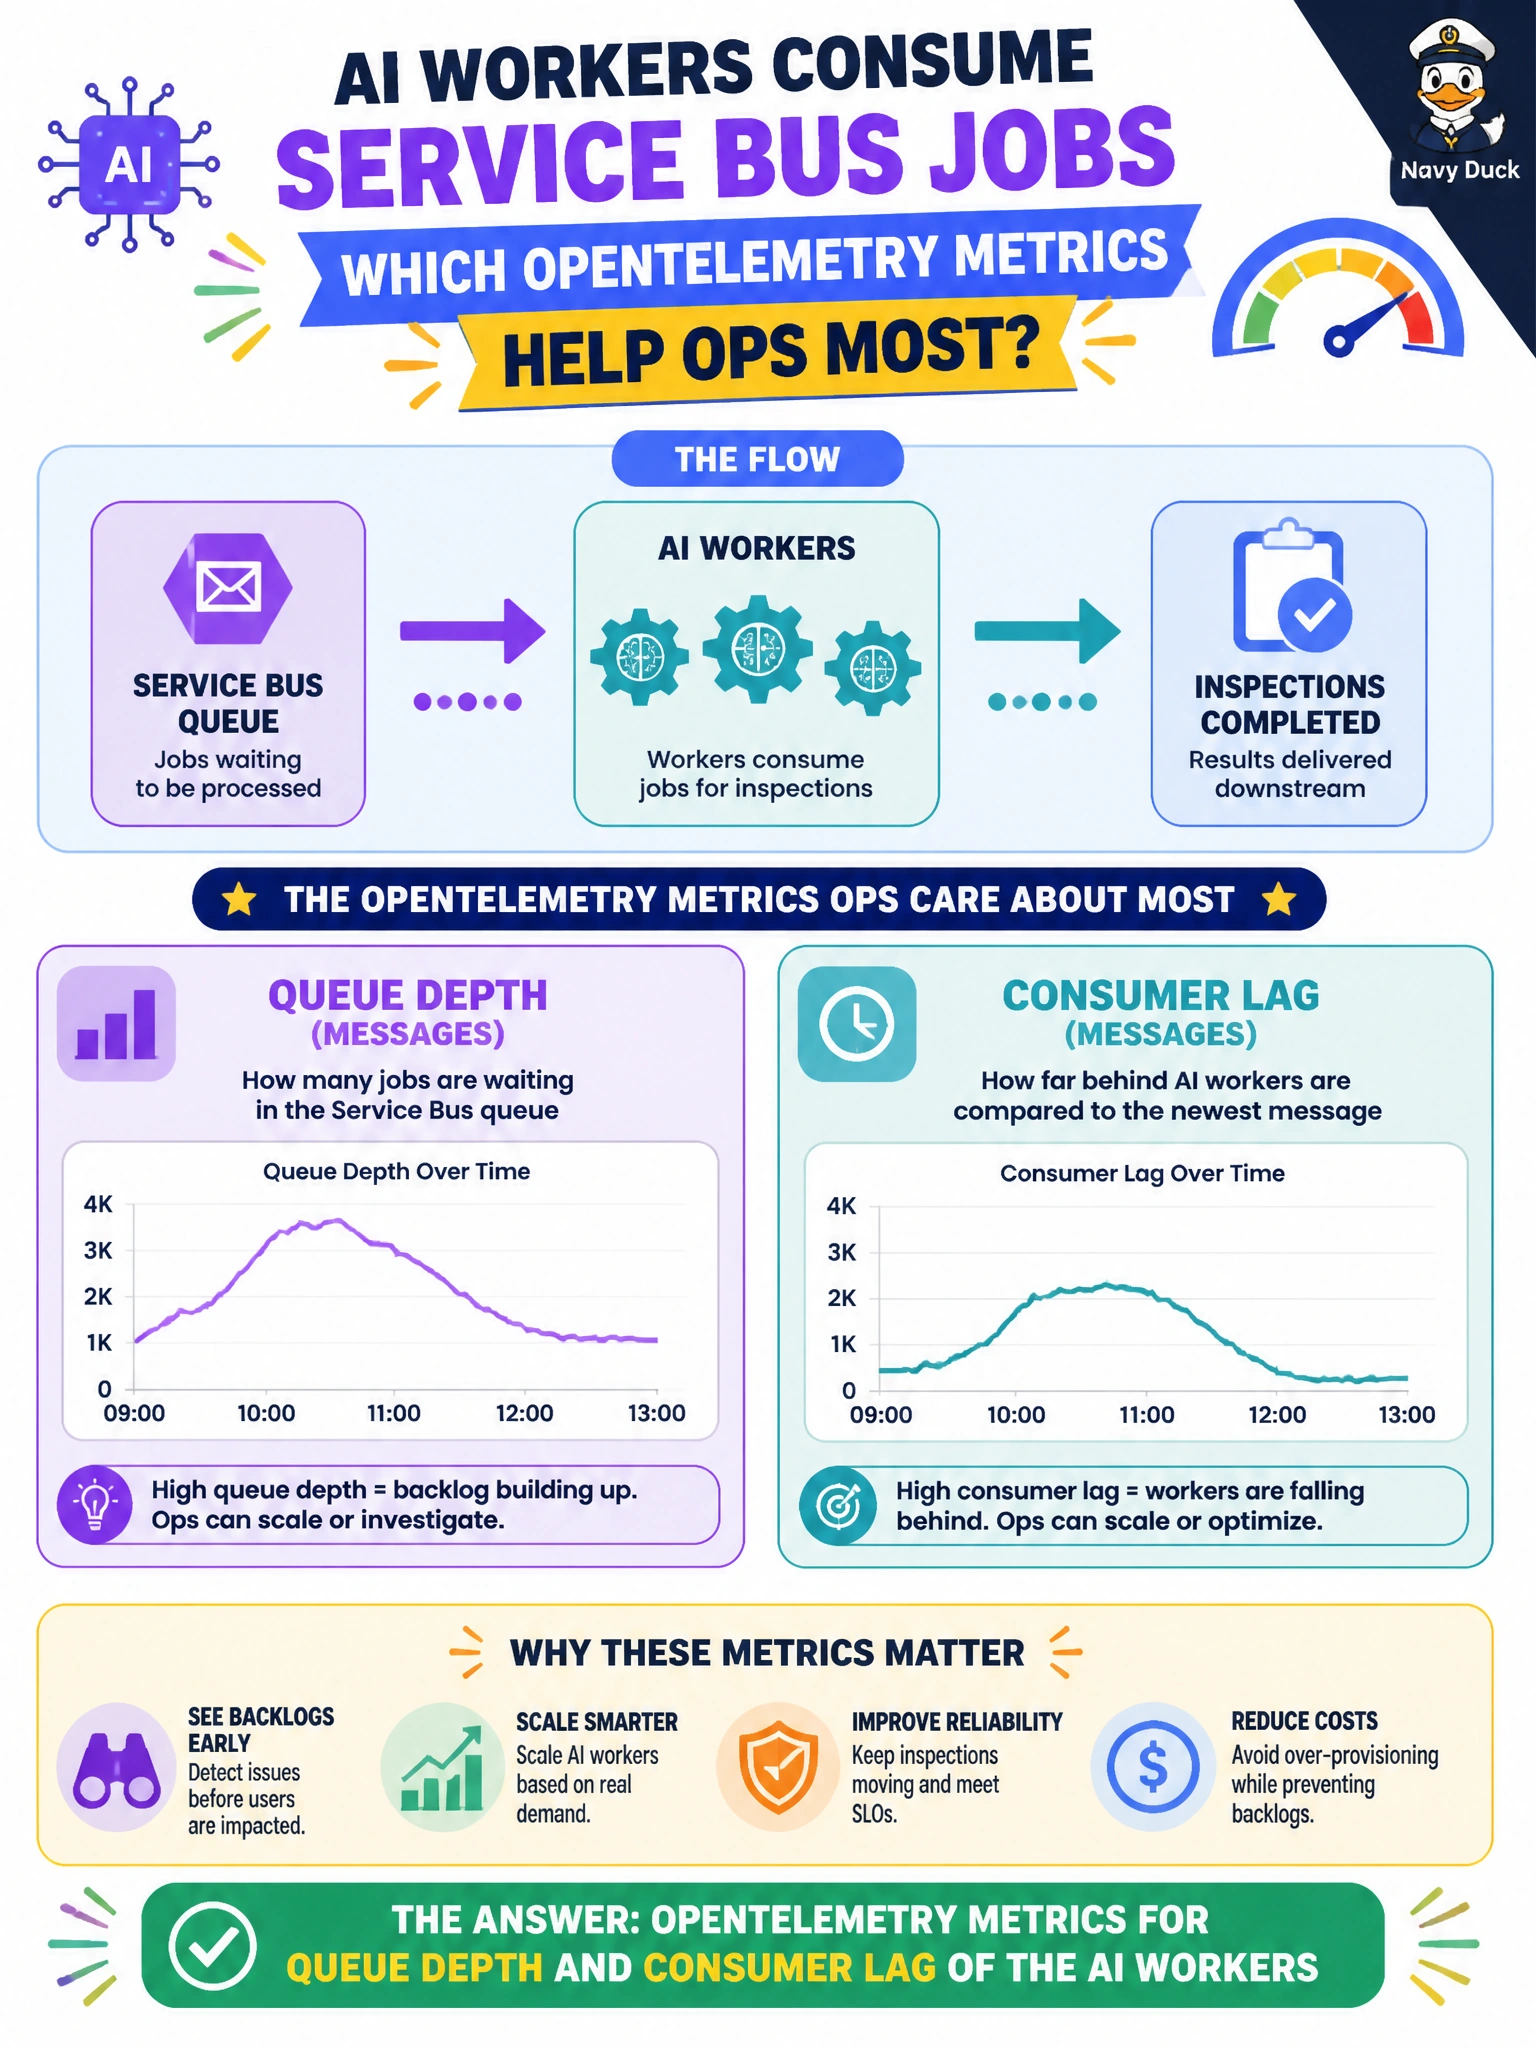
Queue depth and consumer lag are the backlog gauges on the inspection desk—ops sees work piling up or clearing.
Full Explanation
AI workers that consume Service Bus jobs for inspections should expose OpenTelemetry metrics for queue depth and consumer lag. Those metrics tell municipal ops whether inspection work is accumulating faster than workers drain it, whether scaling is needed, and whether a particular consumer group is falling behind before resident appointments and field workflows stall.
Tracking only aesthetic theme colors of the admin portal has no bearing on queue health. Disk partition labels on developer laptops are irrelevant to production inspection workers. ACR geo-replication lag for unrelated container images may matter for deploy distribution but does not measure Service Bus consumption health for AI inspection jobs.
Exam caveat: Queue depth and lag are leading indicators; pair them with process failure rates and dead-letter counts so you do not scale endlessly on poison messages. Metric semantic conventions and consistent service.name resource attributes help dashboards stay clear across the city's worker fleet. Ensure exporters stay enabled under load.
Operational check: Emit and chart queue depth and consumer lag for inspection AI workers, alert when lag exceeds SLA thresholds during business hours, validate that KEDA or manual scale actions reduce lag, and correlate lag spikes with deploy or dependency incidents. Include these tiles on the inspections ops board alongside dead-letter reason summaries.