
Ops suspect Cosmos RU exhaustion on the knowledge store after seeing client errors. What should a KQL investigation look for?
Select an answer to reveal the explanation.
Short Explanation
429s in KQL are the “too many tickets” light on the Cosmos counter—RU exhaustion shows up as throttling, not mystery slowness.
Full Explanation
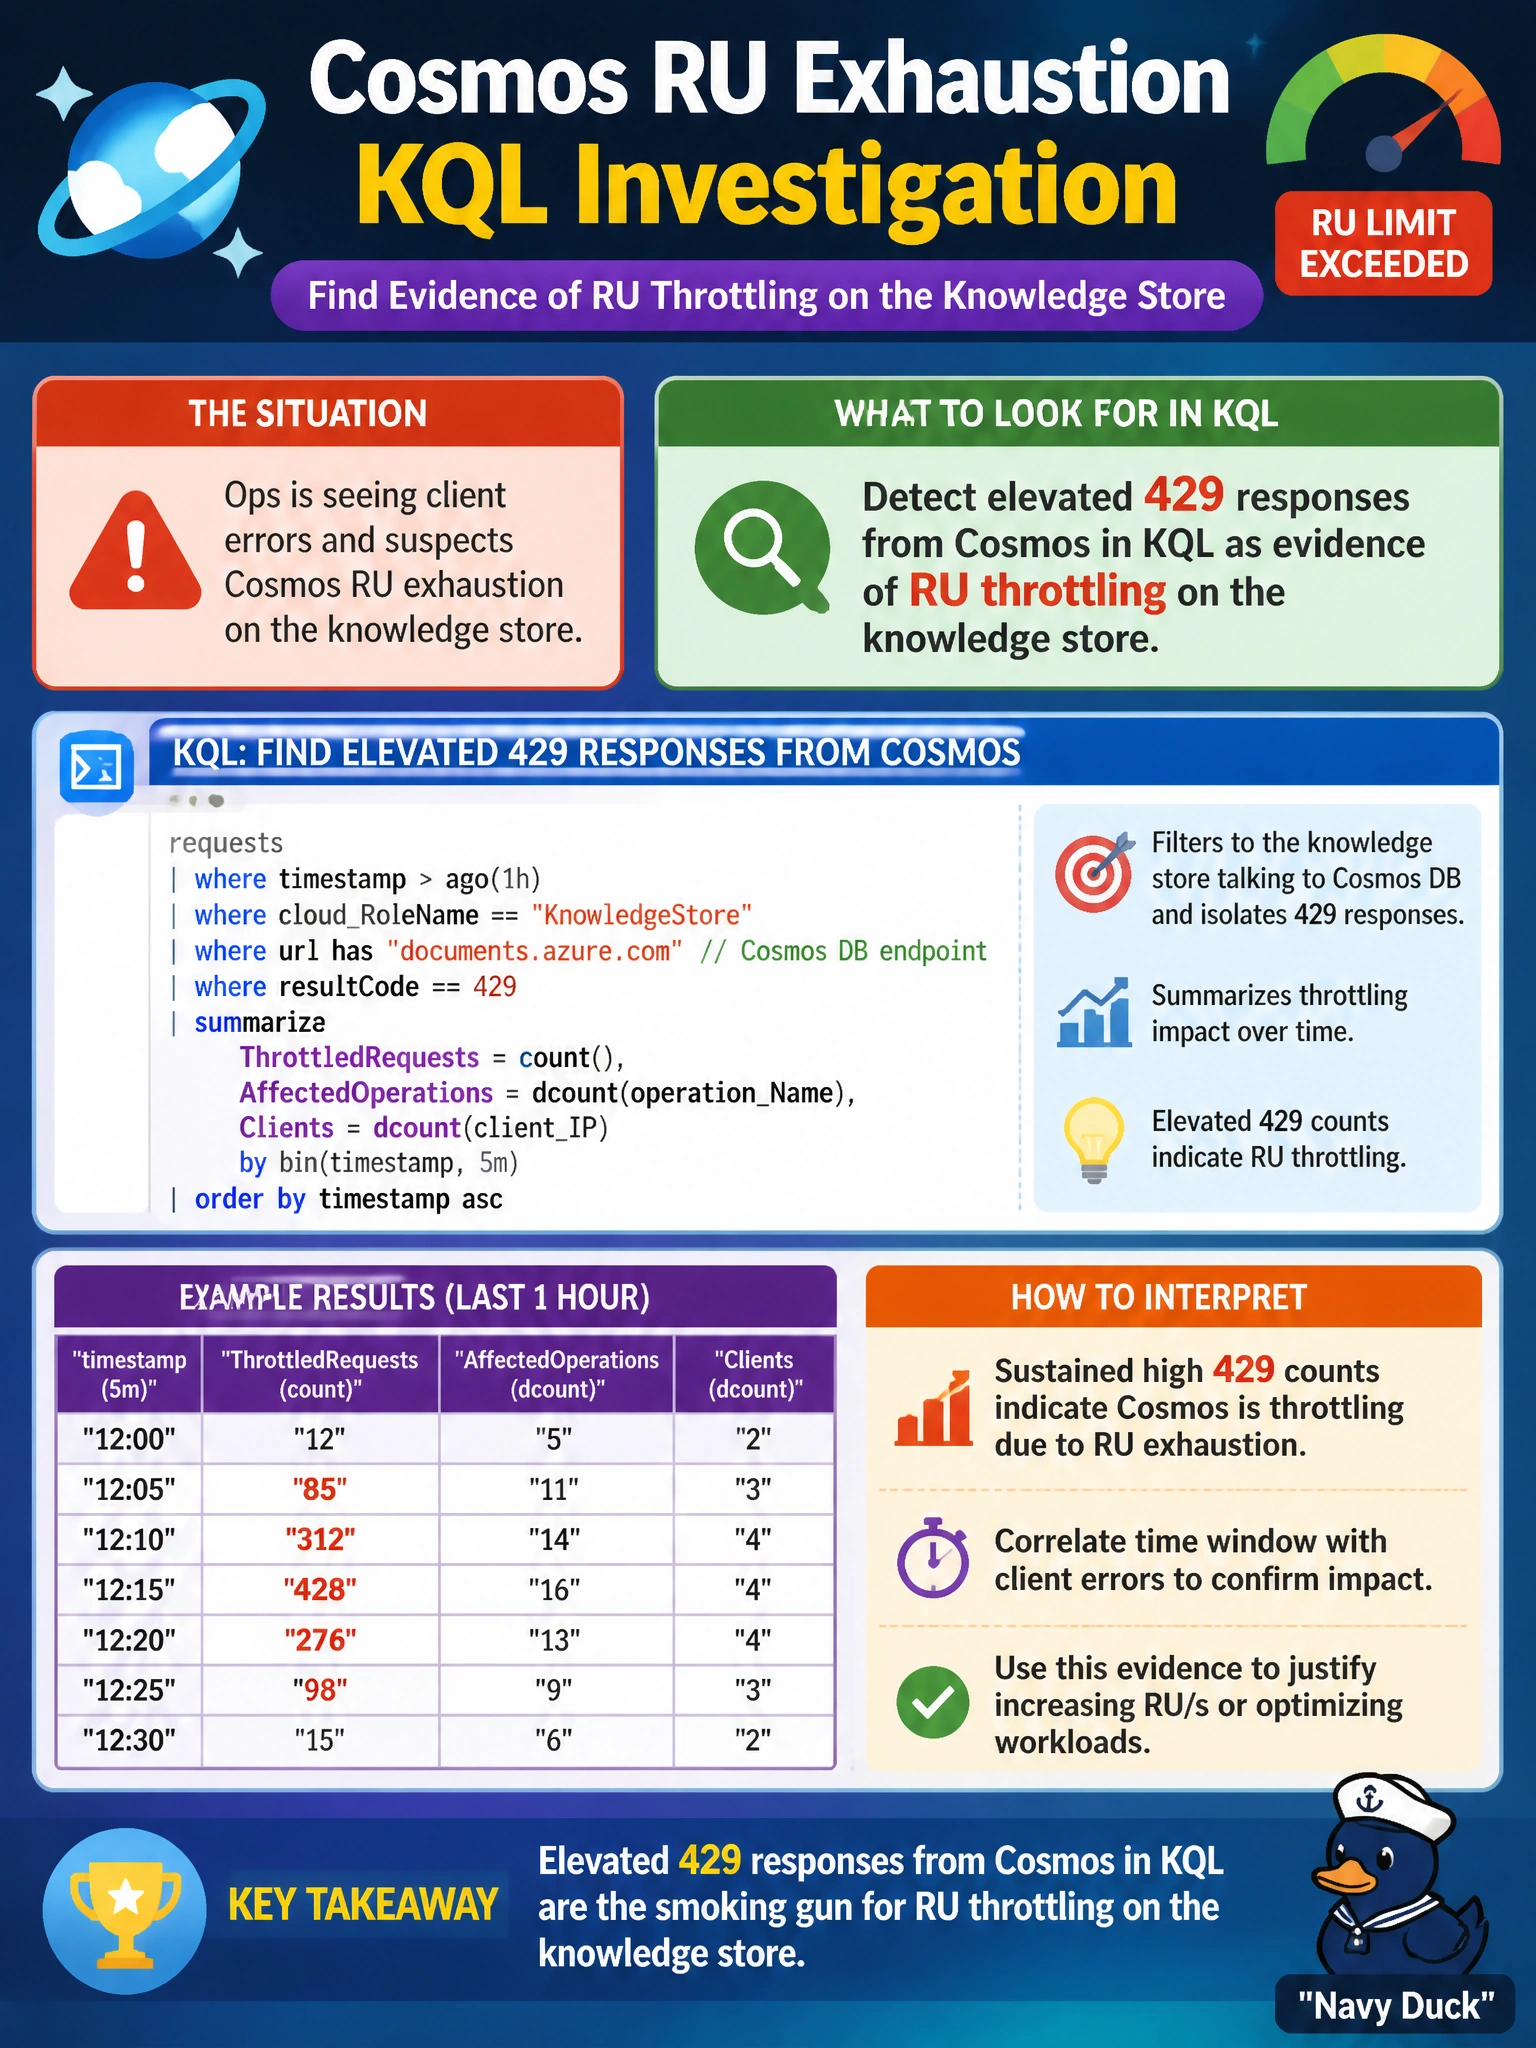
When ops suspect Cosmos RU exhaustion on the knowledge store after client errors, a KQL investigation should look for elevated 429 responses (and related throttling metrics) from Cosmos as evidence of RU exhaustion. Throttling surfaces as HTTP 429 on dependencies or Cosmos diagnostics, often alongside rising latency and retry storms from municipal RAG indexers or query Functions. Finding 429 patterns tied to the knowledge store validates the RU hypothesis before scaling throughput or optimizing queries.
Ignoring HTTP status codes and only charting CPU on an unrelated jump box fails relevance—the jump box CPU does not explain Cosmos throttling. Assuming throttling never occurs if the portal overview looks green once fails because portal snapshots miss intermittent 429 spikes under indexer bursts. Clearing all metrics daily so 429 patterns cannot accumulate fails investigation: you destroy the time series needed to prove RU exhaustion during the incident window.
Exam caveat: not every client error is a 429—401/403 are auth, 404 is missing resources, and 408/503 can have other causes. Retries can amplify RU usage; interpret 429 counts together with normalized RU consumption and partition hot spots. Application retries may hide raw failures unless dependency telemetry records the status code.
Operational check: query Log Analytics for Cosmos dependencies where resultCode == 429 during the incident window, correlate with RU autoscaling charts for the knowledge store, apply a query or RU change, and confirm 429 rates fall while RAG retrieval success recovers.