
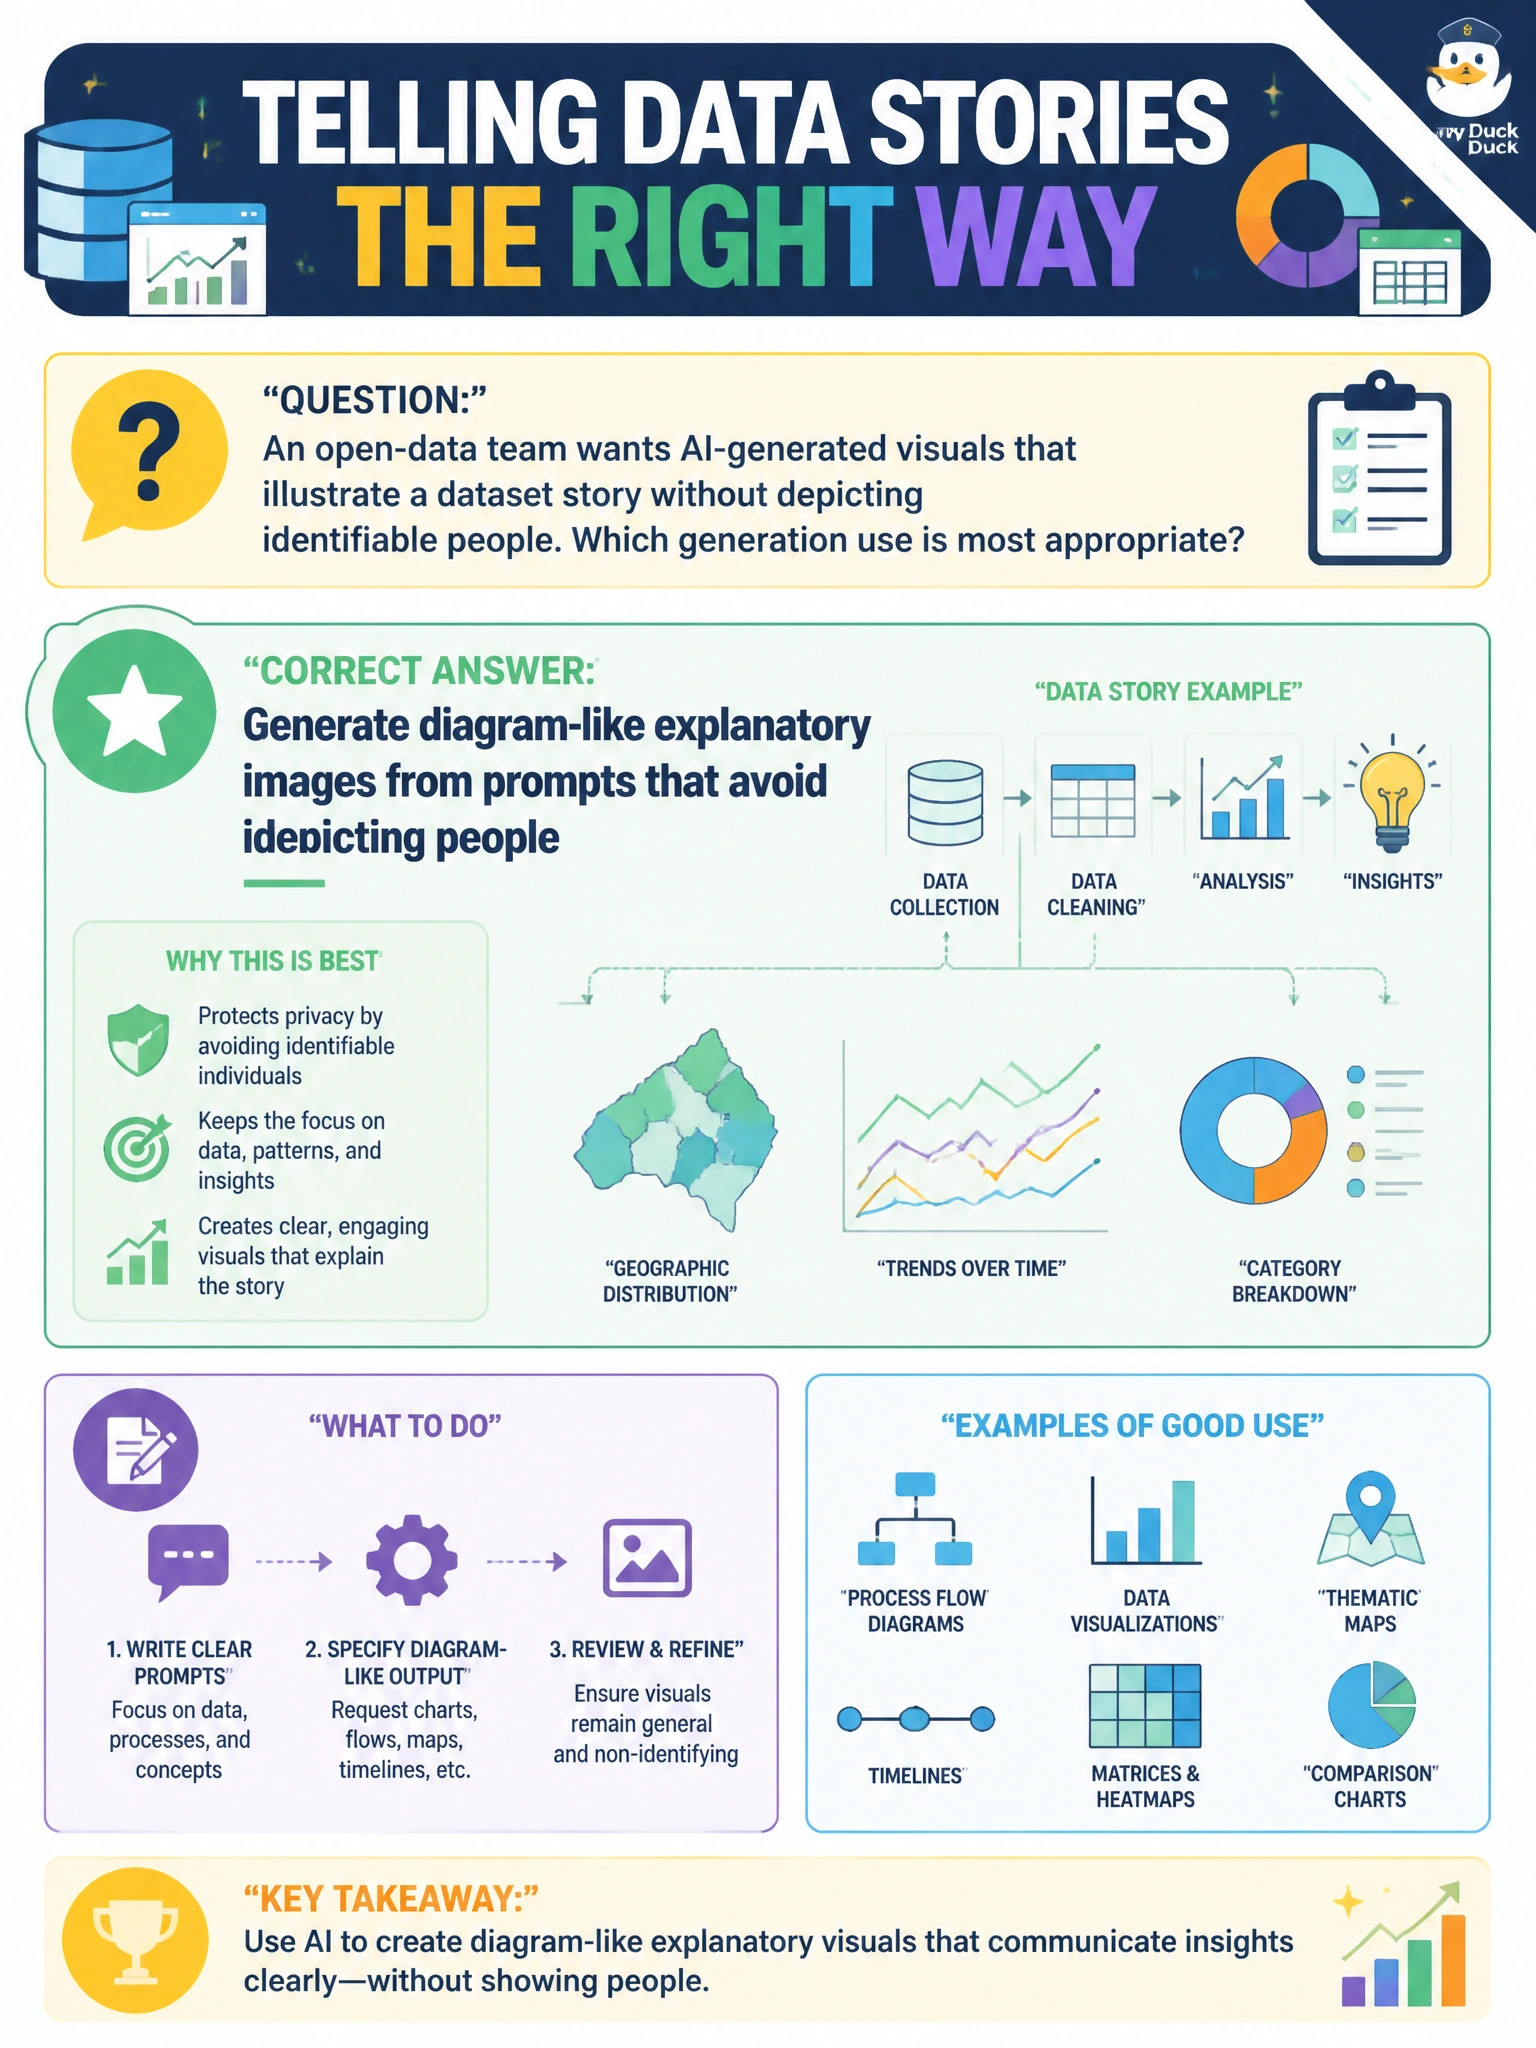
An open-data team wants AI-generated visuals that illustrate a dataset story without depicting identifiable people. Which generation use is most appropriate?
Select an answer to reveal the explanation.
Short Explanation
You'll use pictures of ideas, not precise bar charts that can invent numbers. Prompt for diagram-like explainer art and keep people out of the frame. Precise bar charts, stylized density maps, and infographic panels with captions all risk hallucinated data, so you'll build real figures from the dataset.
Full Explanation
Appropriate civic image-generation use cases emphasize explanatory, diagram-like, or abstract visuals that illustrate a data story without depicting identifiable people. An open-data team should prompt for charts, process diagrams, iconographic scenes, and conceptual illustrations that clarify trends or methods while avoiding photorealistic faces or recognizable residents. That pattern supports public storytelling, reduces likeness and privacy risk, and still delivers the multimodal enrichment residents expect on portal narrative pages. Generating precise bar charts from prompts that avoid depicting people fails on fitness-for-purpose: image models can hallucinate bar heights, axis labels, and numeric values, so precise figures must be built with chart code tied to the dataset rather than AI-painted pixels. Generating stylized density maps from prompts that avoid depicting people fails because generative shading can invent hotspots, blur boundaries, and misplace geography, requiring true GIS rendering for accurate density representation. Generating infographic panels with captions from prompts that avoid depicting people fails on accuracy: models can garble captions, legends, and numbers, so data-bearing text must be typeset from verified sources rather than generated as pixels. Exam caveat: "can generate" is not the same as "should render." Municipal responsible-AI guidance often prefers non-identifying explanatory visuals for open-data communication and deterministic tools for figures even when the model can render precise bar charts from prompts that avoid depicting people. Operational check: review prompts and outputs for AI-painted numbers, labels, or shading that could misrepresent data, keep diagram-style explanatory assets in the publish set, and document that the narrative uses AI-generated explanatory art rather than precise bar charts from prompts that avoid depicting people.
Prefer to study offline? Printable PDF study book + test engine ($7.50, unofficial). These questions stay free here.