
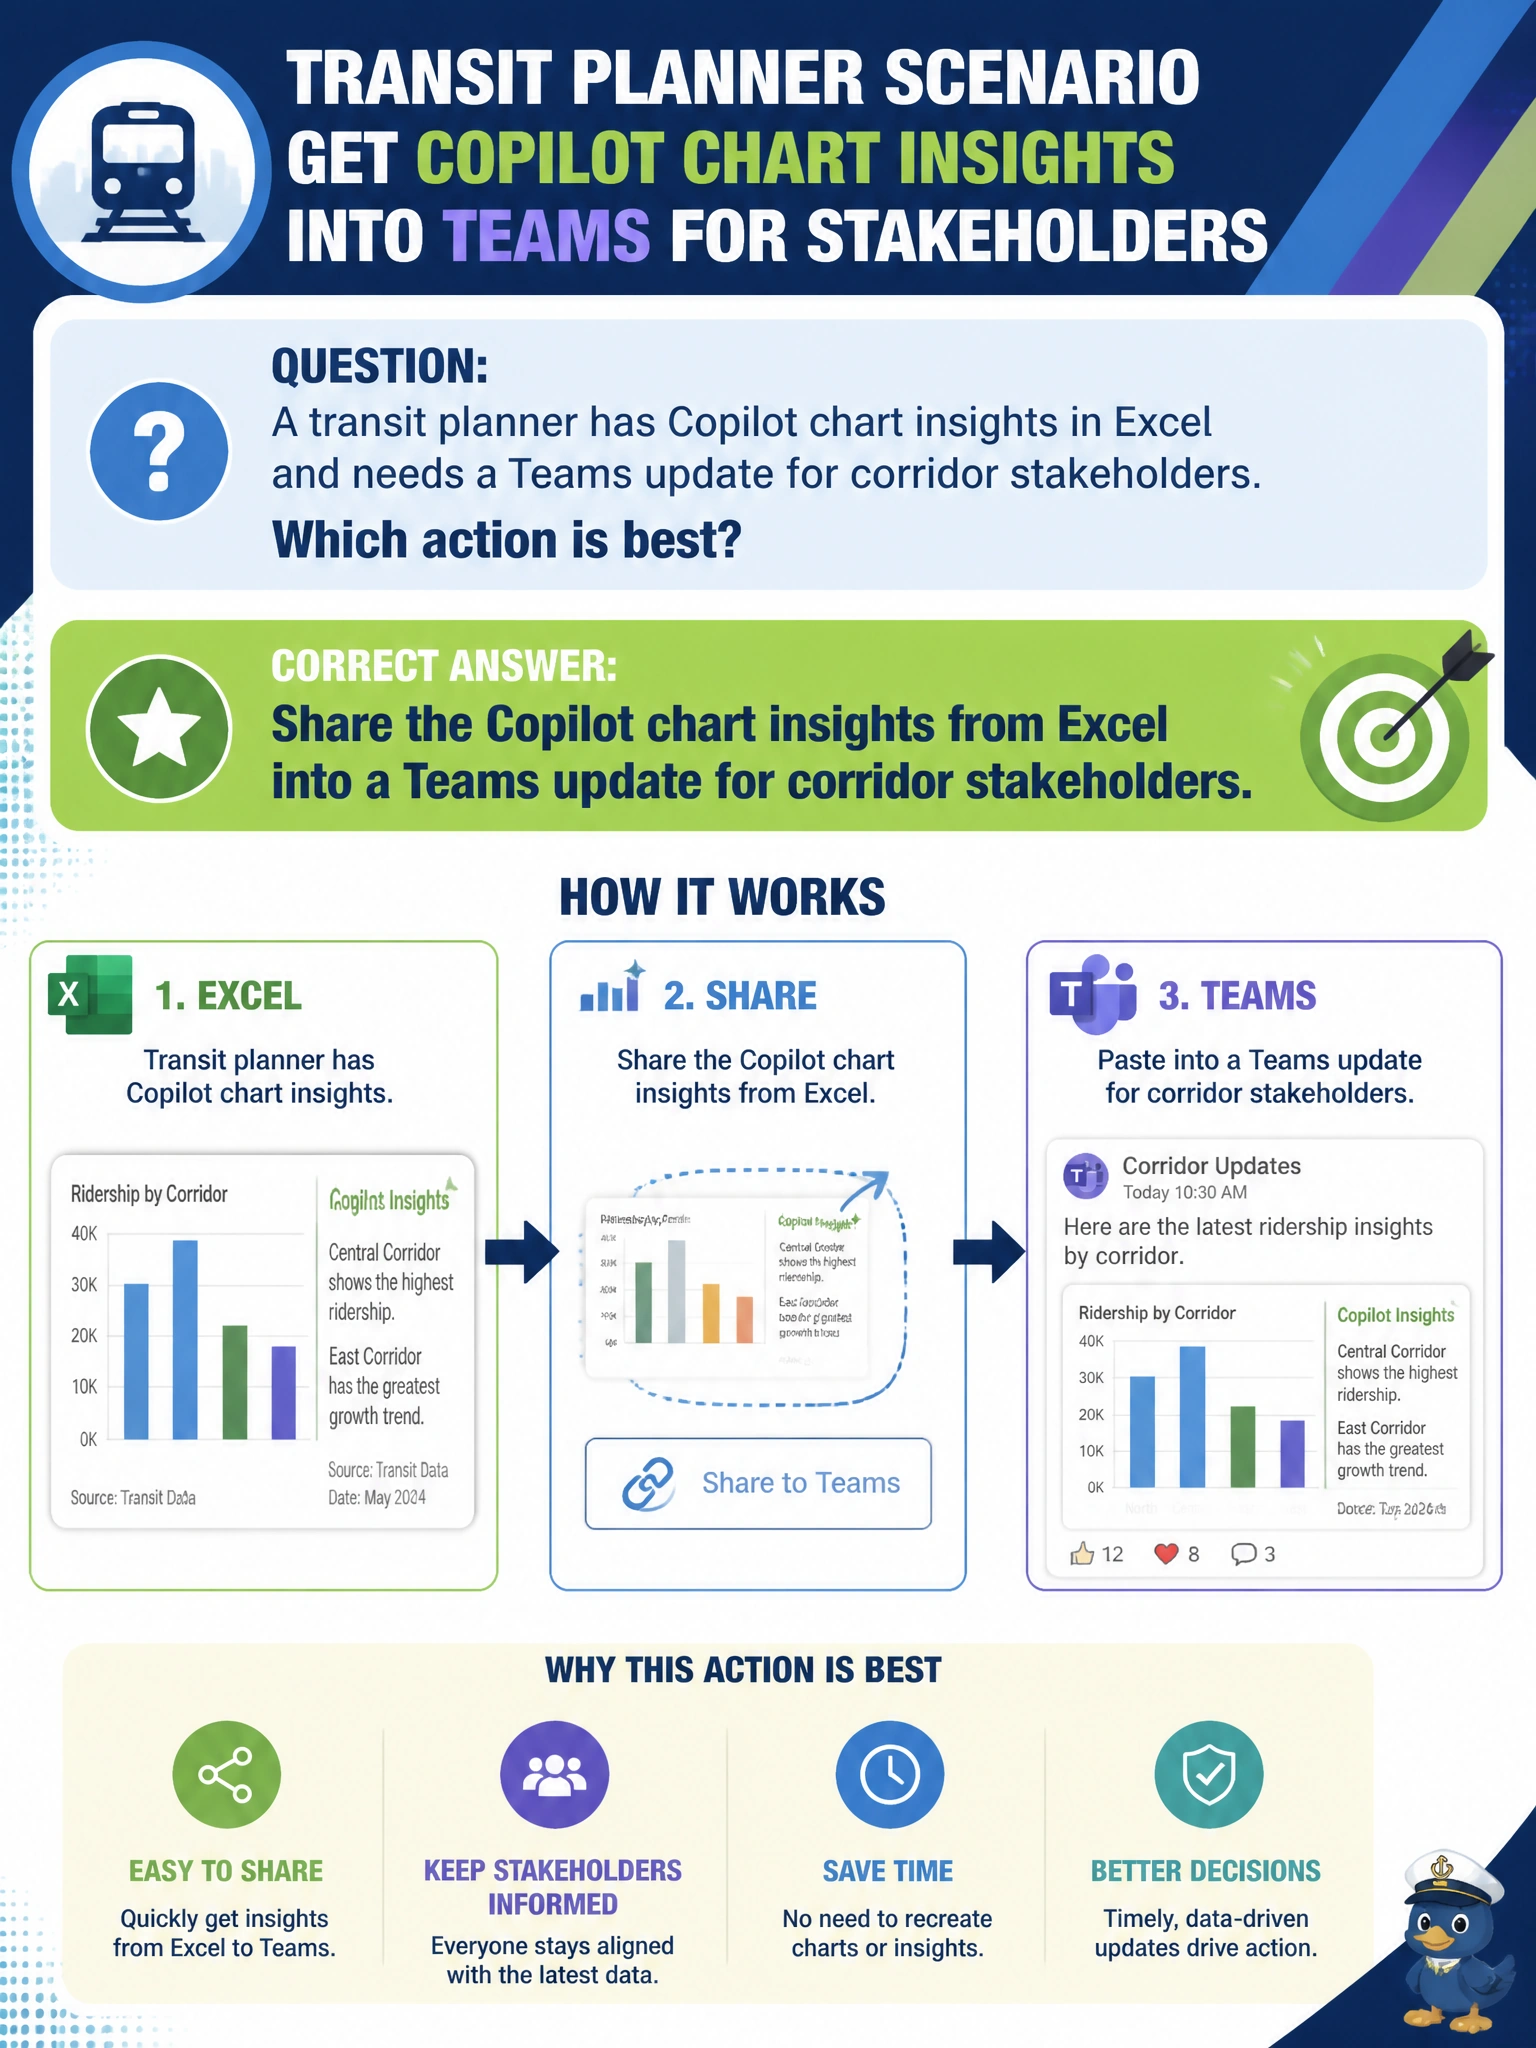
A transit planner has Copilot chart insights in Excel and needs a Teams update for corridor stakeholders. Which action is best?
Select an answer to reveal the explanation.
Short Explanation
Charts in Excel, people in Teams—push those Copilot insights into a stakeholder update. Share the story of the chart, not private HR scores.
Full Explanation
Corridor stakeholders need the meaning of Excel chart insights, delivered where they already collaborate—in Teams. Sharing Copilot chart insights from Excel into a Teams update is the appropriate municipal stakeholder-communication workflow. It preserves trend language from the analysis while keeping private HR performance scores out of the channel and refusing to reverse chart trends for political comfort or optics.
Uploading private employee performance scores from HR into the stakeholder Teams channel fails personnel privacy and is irrelevant to corridor congestion charts. Asking Copilot to reverse chart trends so congestion always appears improved falsifies the analysis. Keeping insights only in a locked personal folder and never updating stakeholders fails the communication duty the stem describes.
Exam caveat: share Excel Copilot chart insights into the Teams stakeholder update. Reject HR score leaks, trend reversal, and non-communication silos.
Operational check: post a Teams update summarizing chart insights with linked visuals, use aggregates only, verify trend direction against the Excel workbook, exclude HR files from the channel, and tag corridor leads for acknowledgment.