
A business analyst at Contoso is preparing a monthly report on their Copilot Studio IT helpdesk agent's effectiveness. The analyst needs to report on total conversations, the percentage of conversations the agent resolved without human intervention, and the percentage that ended without any resolution. Which Copilot Studio Analytics view provides these three KPIs in a single dashboard?
Select an answer to reveal the explanation.
Short Explanation and Infographic
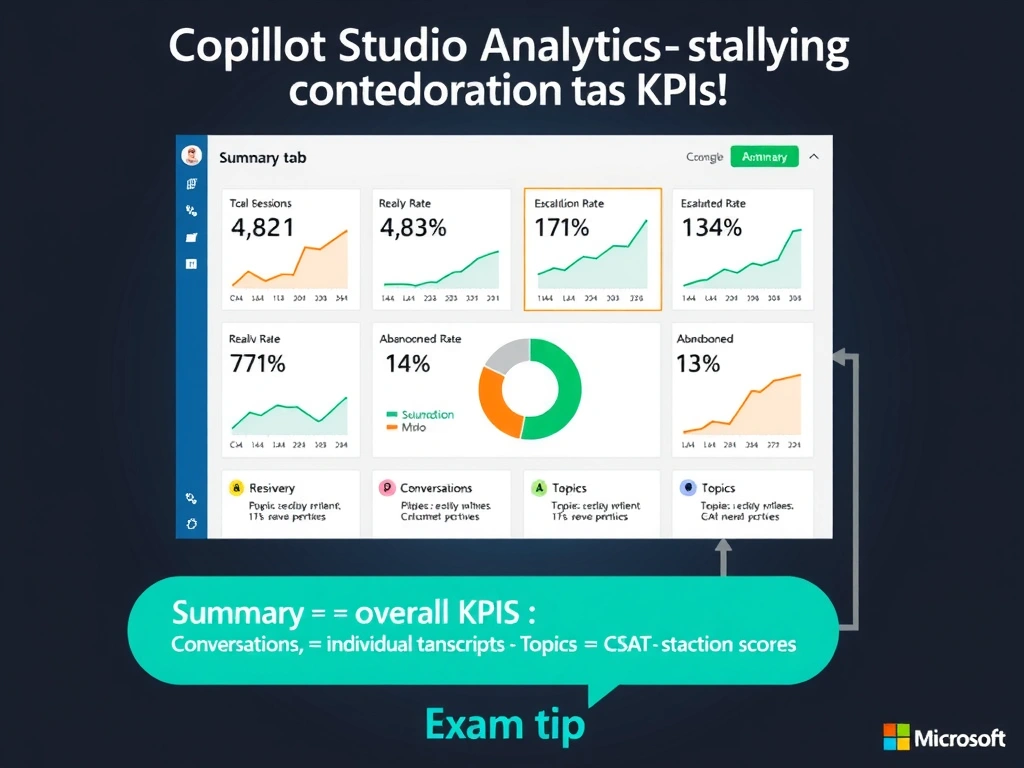
The Summary tab in Copilot Studio Analytics is the executive dashboard — it shows you the scoreboard at a glance. Total conversations, resolution rate, and abandonment rate are the three headline numbers, laid out like a traffic light for your agent's health. If you need to drill into any one metric, you go deeper from there.
Full explanation below image
Full Explanation
The Analytics Summary tab in Copilot Studio provides the top-level operational KPIs for an agent. The three most important metrics it surfaces are: Total sessions (total number of conversations initiated), Resolution rate (percentage of conversations where the agent resolved the user's issue without escalation or abandonment), and Abandonment rate (percentage of conversations where the user left without a resolution).
These metrics are displayed over a configurable time range and can be used to assess overall agent health at a glance. The Summary tab is the starting point for any monitoring or reporting workflow — from here, analysts can navigate deeper into the Conversations or Topics tabs for drill-down analysis.
Option A (Billing tab in Power Platform admin center) is incorrect. The admin center billing view tracks capacity and licensing consumption — message sessions used against entitlements — not agent quality KPIs like resolution or abandonment rates.
Option B (Topics analytics tab) is incorrect. While the Topics tab does show resolution rates, it breaks them down per topic. It does not provide a single unified view of total sessions, overall resolution rate, and overall abandonment rate in one dashboard. It answers 'which topics work best?' not 'how is the agent performing overall?'
Option D (Customer Satisfaction tab) is incorrect. The CSAT tab aggregates satisfaction survey scores and feedback submitted by users. It is a distinct metric — user sentiment — rather than operational outcome rates like resolution and abandonment.
For the AB-620 exam, memorize the four main Analytics tabs and their primary purpose: Summary = overall KPIs (sessions, resolution, abandonment), Conversations = individual transcripts, Topics = per-topic performance, Customer Satisfaction = CSAT scores. The question always points to one of these four by describing what the user needs to see.