
A Copilot Studio maker is debugging a topic called 'Order Status' that is supposed to call a Power Automate flow and return a tracking number. During testing, the agent gives a generic 'I could not retrieve that information' message instead of the tracking number. The maker wants to see the exact path the conversation took through the topic nodes, which branch conditions were evaluated, and what value was stored in the tracking number variable. What should the maker do in the Test pane to diagnose this issue?
Select an answer to reveal the explanation.
Short Explanation and Infographic
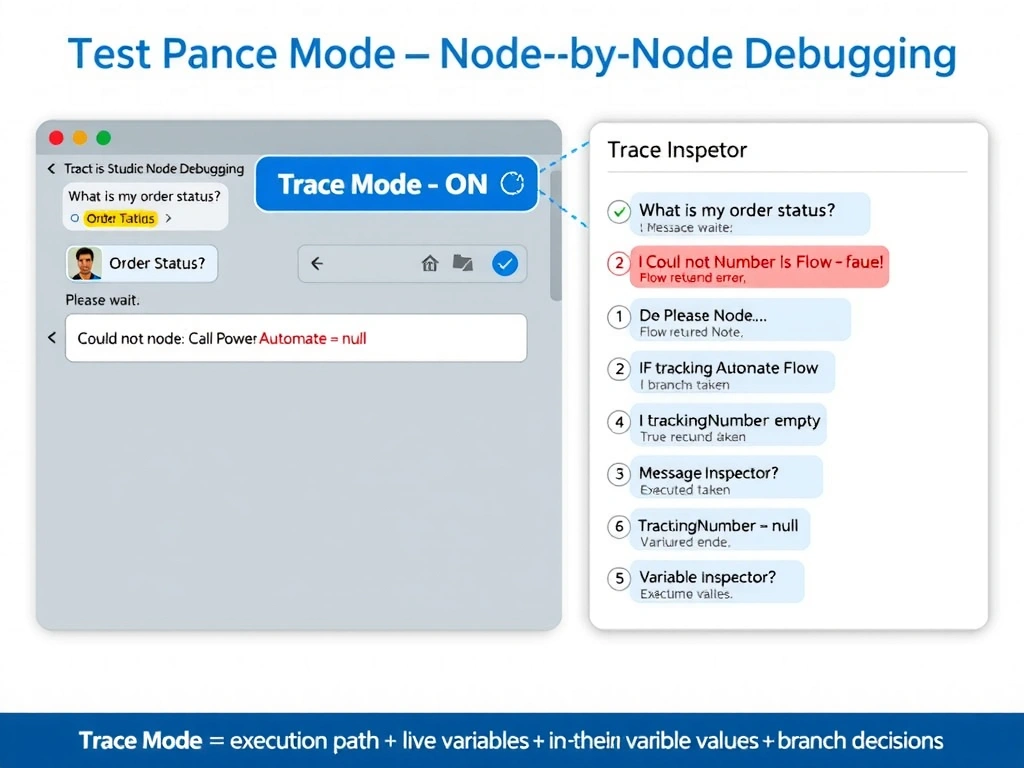
Trace mode in the Test pane is like GPS navigation for your topic — it shows you exactly which turn the conversation took at every fork in the road. You can see each node fire in sequence, check what value landed in each variable, and immediately spot where the flow went wrong without leaving the studio.
Full explanation below image
Full Explanation
Trace mode in the Copilot Studio Test pane is a developer diagnostic tool that provides a step-by-step view of topic execution during a test conversation. When enabled, each node in the topic is highlighted as it executes, the conversation trace panel shows the sequence of nodes visited, and variable values are displayed at each step so the maker can verify what data the agent holds at any point in the flow.
For this scenario, trace mode would show: whether the 'Order Status' topic was correctly triggered, whether the Power Automate flow call was executed, what the flow returned (or whether it returned an error), and what value — if any — was stored in the tracking number variable before the message node rendered its response. This level of visibility makes it straightforward to identify whether the failure is in the flow execution, the variable assignment, or the condition logic.
Option A (Analytics conversation transcripts) is incorrect. Analytics transcripts show the messages exchanged in a conversation but do not expose node-level execution paths, branch conditions, or variable values during a test session. They are designed for post-conversation review of production conversations, not maker debugging.
Option B (export to YAML and manual inspection) is incorrect. While topics can be exported, manual YAML inspection is an indirect and error-prone debugging method. It does not provide runtime values or show which code path was actually executed — only the static definition.
Option D (publish to test channel and capture Azure logs) is incorrect. This approach is overly complex for diagnosing a topic-level flow issue. Trace mode in the Test pane is specifically designed to solve this problem without requiring deployment or external tooling.
For the AB-620 exam: the Test pane has two key debugging features — the conversation chat interface and trace mode. Trace mode is always the answer when the question involves inspecting execution flow, variable values, or branch conditions during topic testing. Remember that trace mode requires the maker to be in the Copilot Studio authoring environment.