
During a test conversation in the Copilot Studio Test console, a maker notices that a condition node is taking the wrong branch. They suspect a variable has an incorrect value. What Test console feature helps them diagnose this without adding extra 'send message' nodes to display variable values?
Select an answer to reveal the explanation.
Short Explanation and Infographic
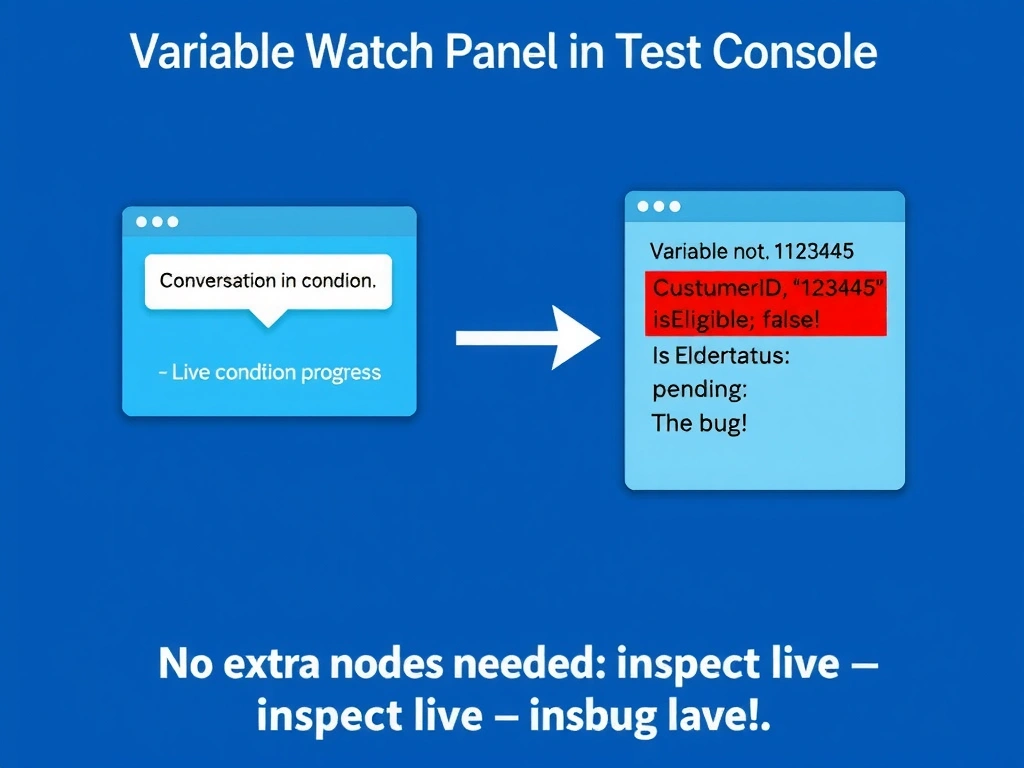
The Test console's variable watch panel is like a debugger's watch window — it shows live variable values updating in real time as each node executes. No extra nodes, no export, no guesswork.
Full explanation below image
Full Explanation
The Copilot Studio Test console includes a real-time variable inspection capability. As the conversation progresses through nodes, a panel in the Test console shows the current values of all topic variables, global variables, and system variables that are in scope. This updates as each node executes, allowing makers to see exactly what value a variable holds at the moment a condition is evaluated.
This feature eliminates the need for 'print statement debugging' (adding temporary message nodes to display values) — a common but cumbersome workaround.
Option A (verbose logging to transcript) — while some logging integrations exist, Copilot Studio's Test console doesn't have a 'verbose logging' toggle that surfaces variable values in the transcript text. The variable panel is the correct tool.
Option C (CSV export) — conversation transcripts can be reviewed, but they don't capture variable state snapshots at each node execution.
Option D (temporary message node) — works but is the manual, invasive workaround the question explicitly asks to avoid. It also requires remembering to remove the debug node before production deployment.
Exam debugging tip: Test console variable panel = live debugging for variable state. Combined with the topic navigation tracker (shows which node is active), this gives makers all the information needed to diagnose most logic issues.