
A Copilot Studio agent at Fabrikam is intermittently failing when it calls an external HR API. The developer needs to find which specific API calls are failing, what error codes are returned, and at what time the failures occur. Which monitoring tool provides this level of detail?
Select an answer to reveal the explanation.
Short Explanation and Infographic
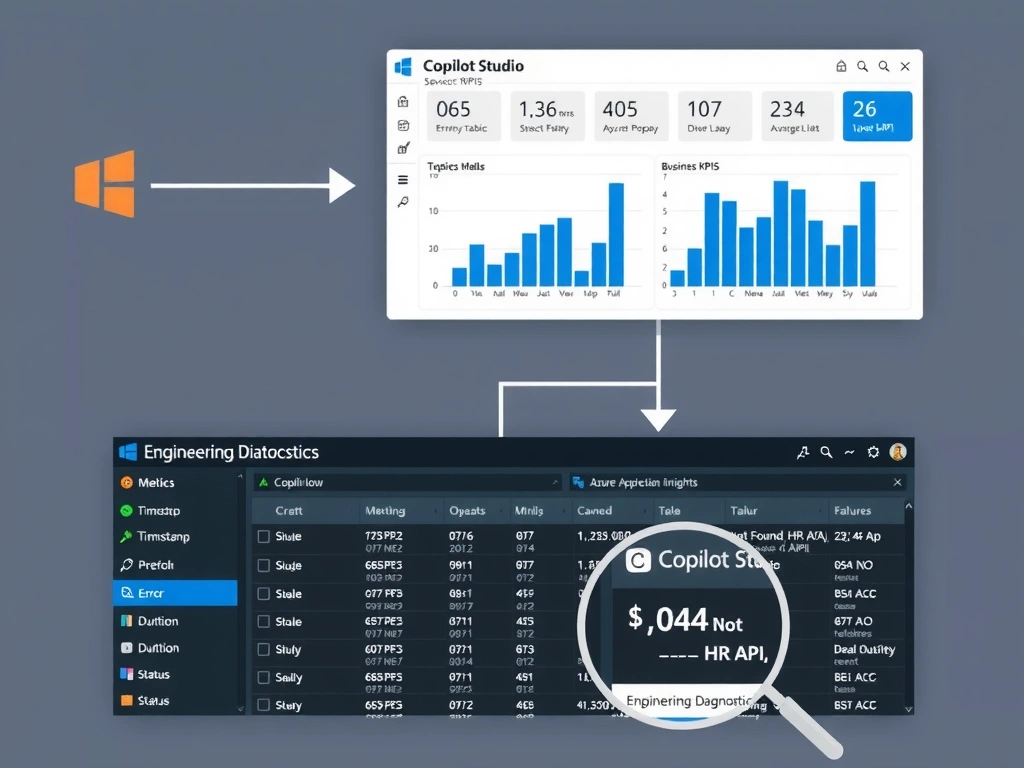
Copilot Studio's Analytics dashboard gives you the big picture; Azure Application Insights is the microscope for diagnosing specific API failures with error codes, timestamps, and stack traces. The correct answer is B.
Full explanation below image
Full Explanation
## Why B is Correct For detailed operational monitoring — specific error codes, HTTP status codes from external APIs, timestamps, and failure frequencies — you need Azure Application Insights or Azure Monitor. Copilot Studio can be connected to Application Insights, which then receives telemetry including action call failures, error details, and correlation IDs for debugging. This level of granularity is not available in the built-in Analytics dashboard.
## Why the Distractors Are Wrong A (Analytics dashboard 'Errors' tab): The built-in Analytics section shows aggregate metrics like escalation rates and topic failure counts — not individual API call error codes or HTTP status details.
C (Capacity usage report): The Power Platform admin center's Capacity usage report tracks resource consumption (AI Builder credits, storage) — not application-level error details.
D (Test pane history): The Test pane is for interactive testing during development — it shows the current session's conversation but does not log or retain historical error data from production sessions.
## Exam Tip Monitoring levels: Built-in Analytics = business-level KPIs. Azure Application Insights = engineering-level diagnostics. For error code-level debugging, the answer is always Application Insights.