
A Copilot Studio administrator at Contoso wants to review how users have been interacting with an agent over the past 30 days — specifically how many conversations were handled, which topics were triggered most, and how many conversations ended without resolving the user's issue. Where should the administrator look for this data?
Select an answer to reveal the explanation.
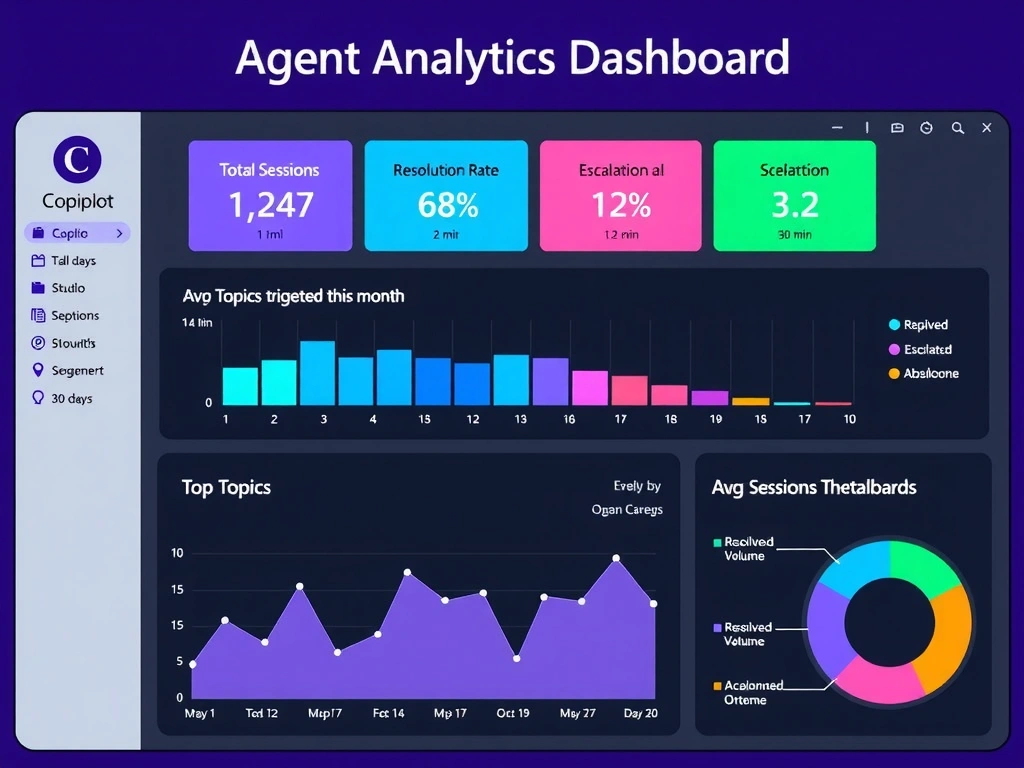
Short Explanation and Infographic
Copilot Studio's built-in Analytics section is the dashboard for your agent's health — session counts, topic hit rates, escalations, and resolution rates are all there without needing to write any queries. The correct answer is B.
Full explanation below image
Full Explanation
## Why B is Correct Copilot Studio includes a built-in Analytics section for each agent that provides: - Session volume (total conversations, sessions by channel, over time) - Topic engagement (which topics were triggered, how often, and completion rates) - Escalation rate (conversations handed off to human agents) - Abandonment/resolution (sessions where the user left without resolution vs. fully resolved)
This data is pre-aggregated and visualized — no queries or exports needed for standard reporting.
## Why the Distractors Are Wrong A (Azure Blob Storage transcripts): Transcripts can be exported to Blob Storage for deep analysis, but the Analytics section provides pre-built reports without requiring data engineering setup.
C (Dataverse query in admin center): While Dataverse stores conversation data, running custom queries requires technical knowledge and is not the primary monitoring interface for business users.
D (Power Automate flow run history): Flow run history shows individual flow executions — it is not the right tool for conversation-level analytics like topic engagement or session resolution rates.
## Exam Tip For standard agent monitoring: use the Analytics section in Copilot Studio. For deep custom analysis: export to Azure Monitor or Data Lake. Know both paths but default to the built-in Analytics for exam scenarios.