
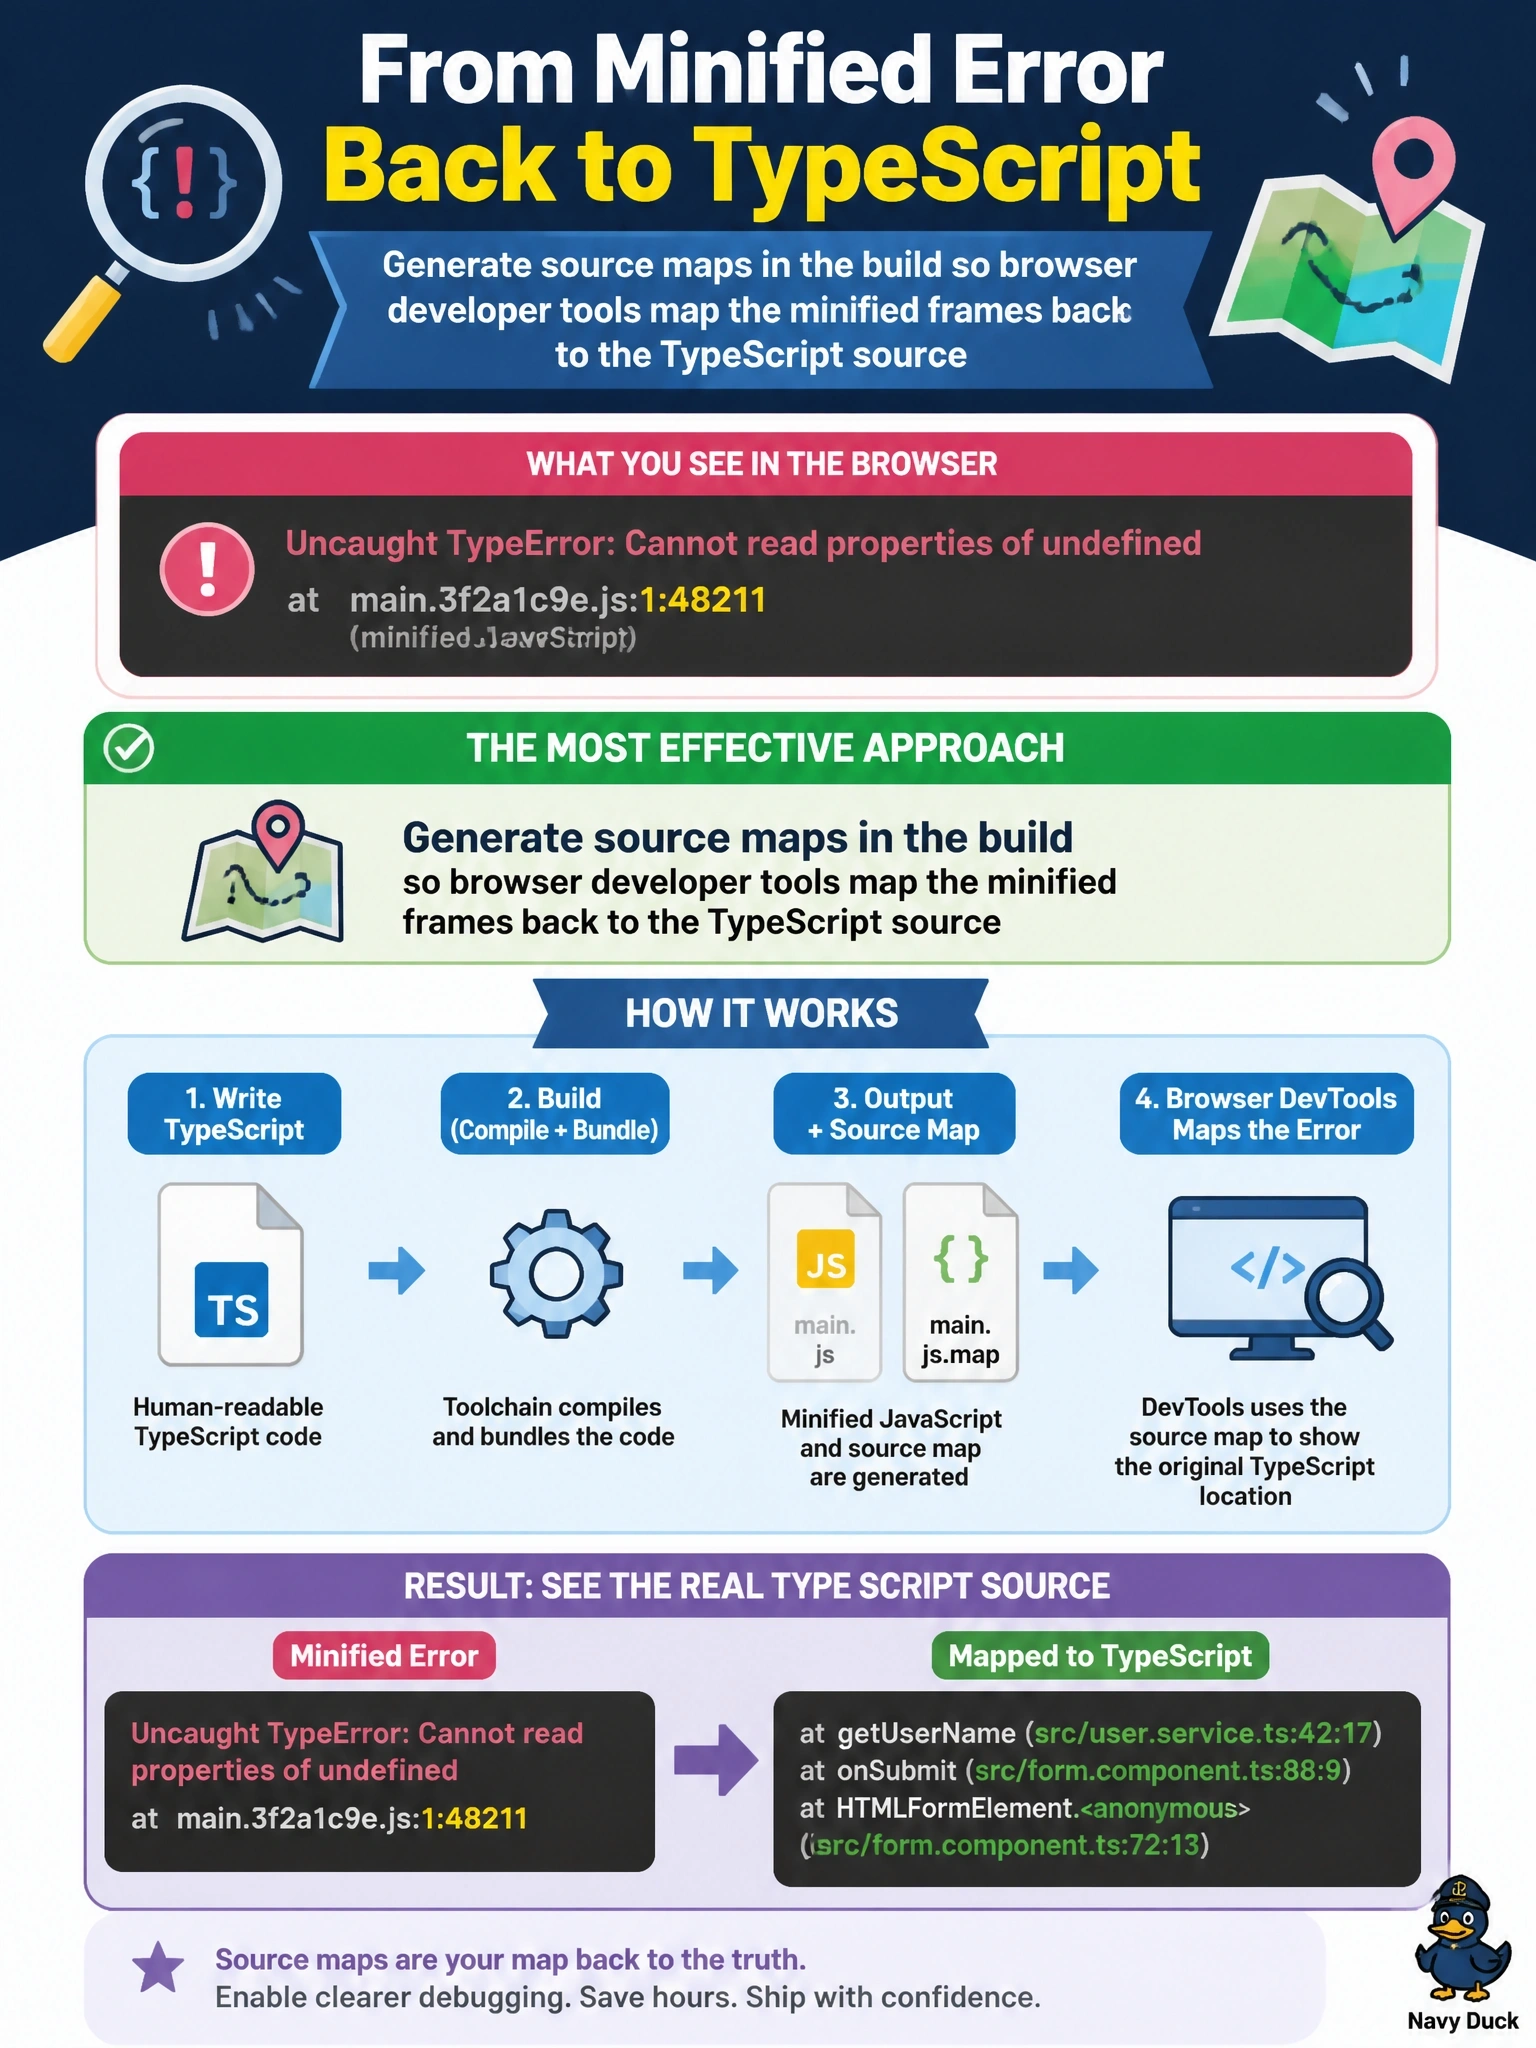
An exception in a deployed code app shows a stack trace pointing into a single minified JavaScript file at line 1, column 48211. The developer needs to find the TypeScript line that threw. What is the most effective approach?
Select an answer to reveal the explanation.
Short Explanation
A minified bundle is like a book with all the line breaks removed; good luck finding page 12. Source maps are the index that maps each spot back to your original TypeScript. Don't expect a logging tool or a CLI refresh to rebuild that index for you.
Full Explanation
Bundlers such as Vite minify and concatenate code for production, which collapses the app into a few files where positions no longer resemble the source. Source maps record the mapping from each position in the output back to the original file, line and column. When the build emits source maps and the browser can load them, developer tools show stack frames and breakpoints in the TypeScript source, so the failing line is immediately visible. Reproducing the error locally in development mode, which serves unminified modules, is a complementary way to step through the same code. Application Insights does not de-minify browser stack traces on its own; mapping requires source maps to be supplied, so without them the trace stays minified. pa app refresh data-source regenerates generated model and service files for a data source; it has nothing to do with bundle output or line numbers. Every statement in a minified bundle is typically on the same few lines, so a breakpoint on line 1 stops far from the relevant code and does not reveal the source line. Exam caveat: decide deliberately whether to publish source maps with production assets, because code app assets are served from a publicly accessible endpoint. Operational check: enable source maps, rebuild, reproduce the exception, and confirm the stack trace shows TypeScript file names.