
In a production code app, a SharePoint connector call fails for some users while working for others, and the app shows only a generic error message. The developer needs the actual status code and error body returned for an affected user. What should the developer do?
Select an answer to reveal the explanation.
Short Explanation
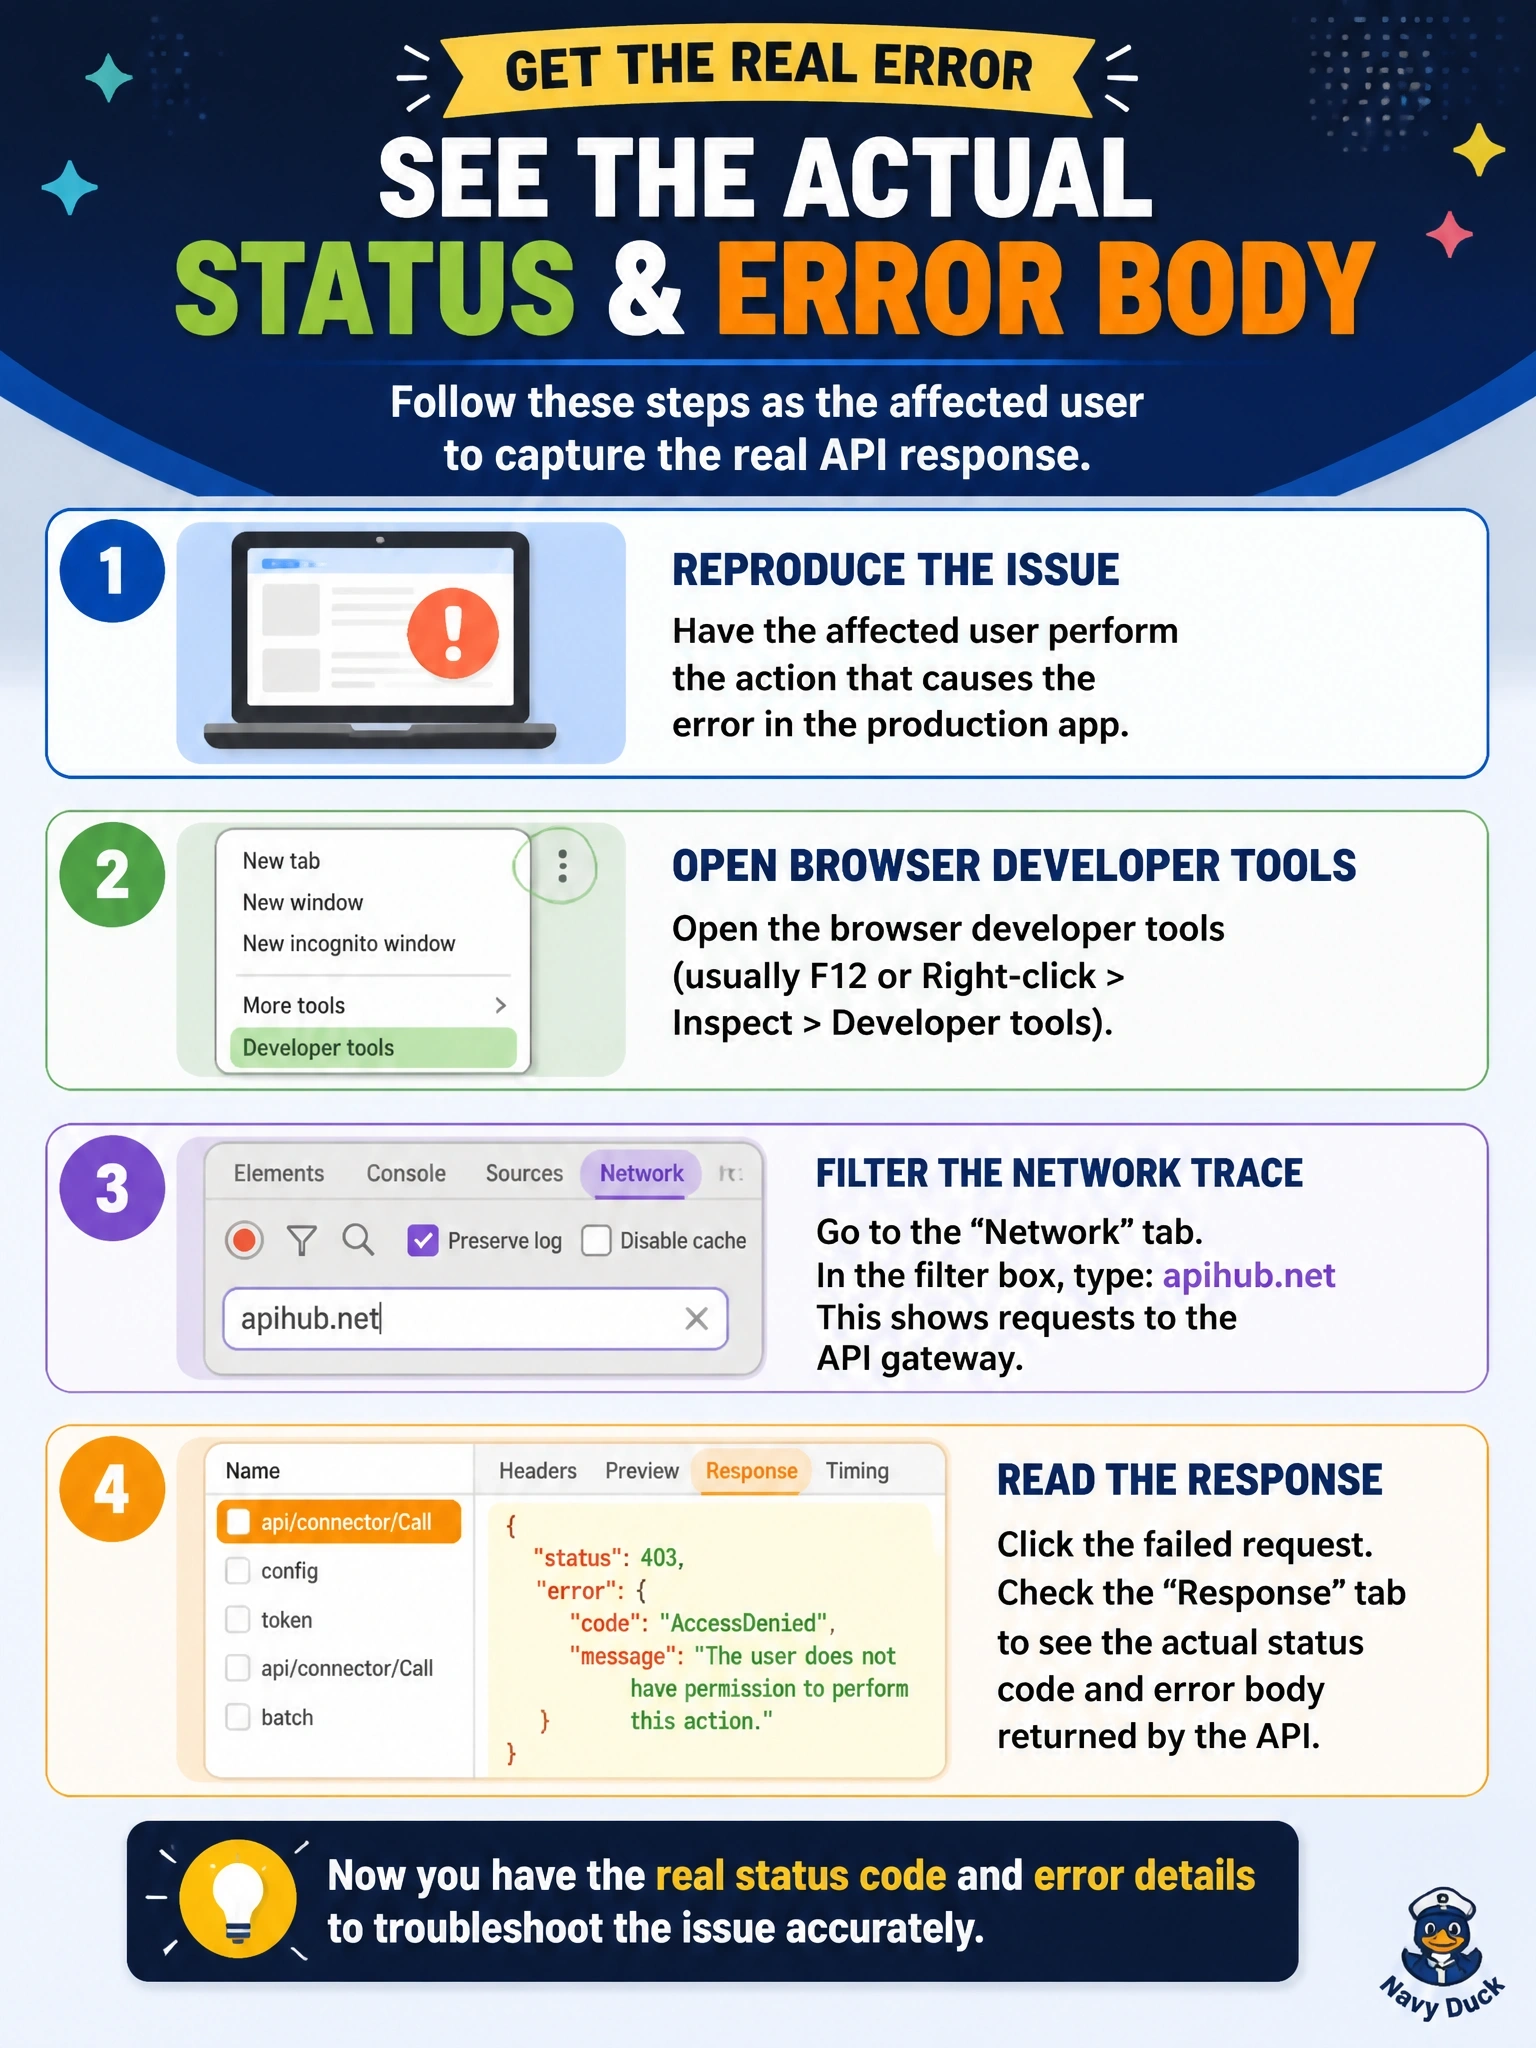
When only some users break, you've got to watch the failure happen in their session. Open the browser's dev tools with an affected user, filter on apihub.net for connector calls, and the real status and error body are right there. Don't debug under your own account; it works for you, remember?
Full Explanation
Code app data requests are visible in browser developer tools, and Microsoft documents filter strings for separating them: apihub.net for connector requests and dynamics.com for Dataverse. Having an affected user reproduce the failure while the developer watches their network trace, or while they capture it, exposes the failing connector request with its HTTP status code and response body, which typically names the cause, such as missing permissions on a site or list for that user. The app's generic message hides those details, which is why the trace is needed. pa app set-setting currently manages app settings such as header visibility; it does not raise a log level or change how the app reports errors. Running locally as the developer misses the point, because the stem says the failure is user-specific and the developer's account works. Filtering on dynamics.com shows Dataverse traffic, not SharePoint connector traffic, so the failing request would never appear. Exam caveat: browser tools show what happened in a session after load; failures before the app loads are better diagnosed with Monitor and platform health metrics. Operational check: export the trace as a HAR file from the affected session, locate the failed apihub.net request, and record its status code and error message.