
Operations wants page views and unhandled browser exceptions from a production code app sent to Azure Monitor Application Insights. The team has already created an Application Insights resource. What must the developer add to the code app?
Select an answer to reveal the explanation.
Short Explanation
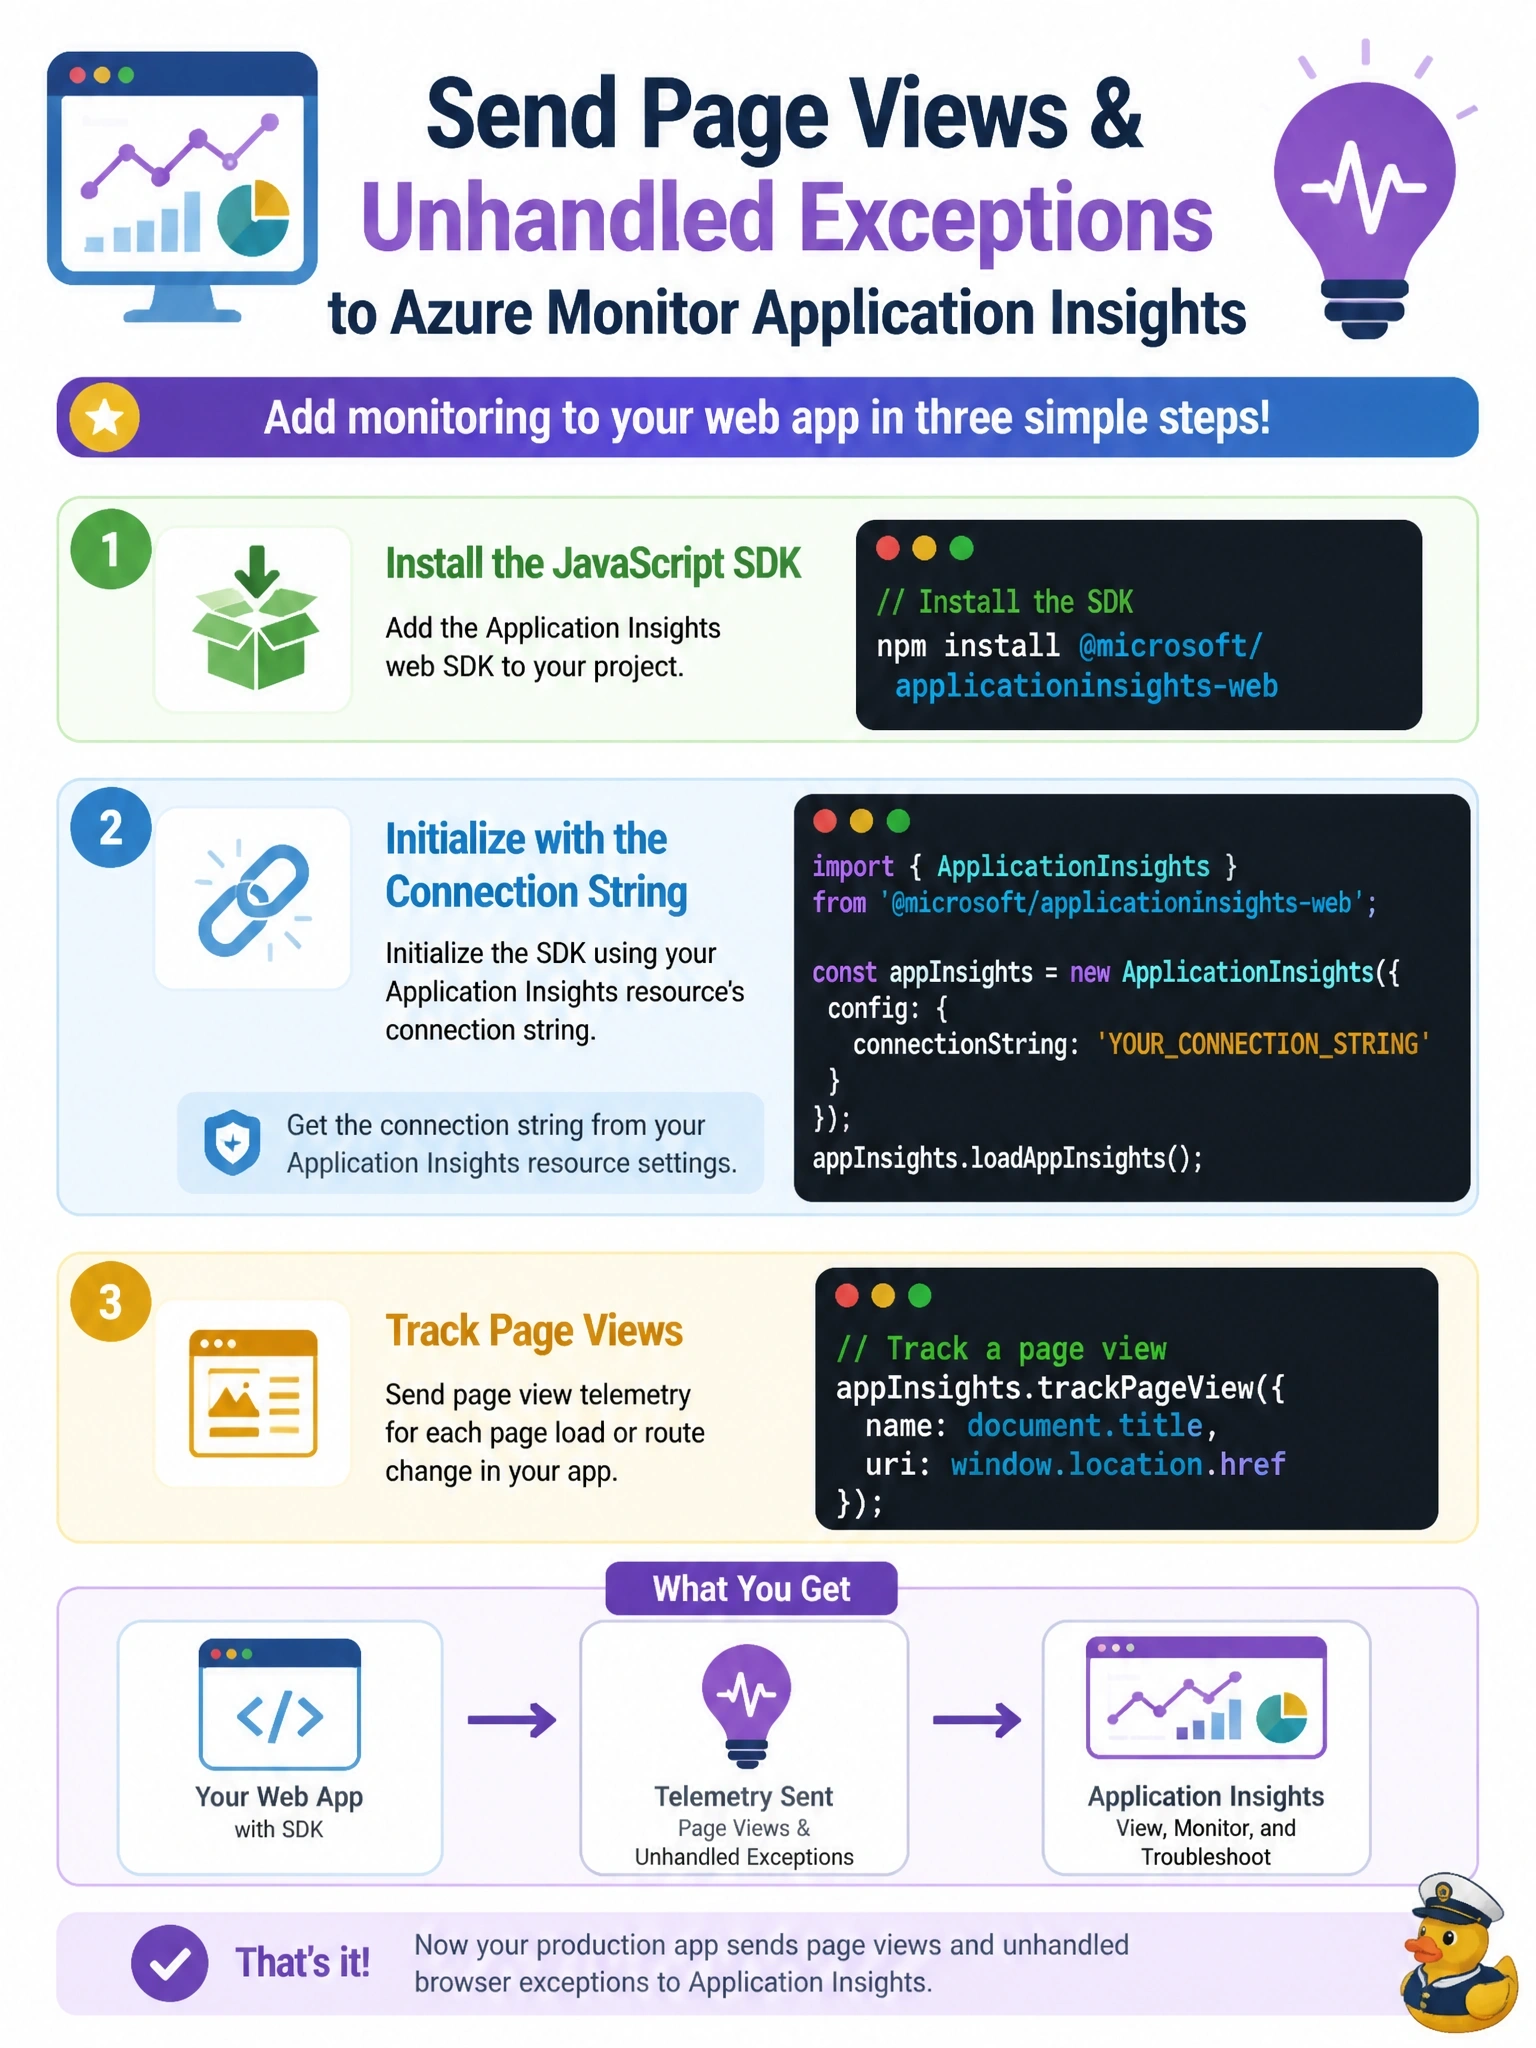
Application Insights doesn't show up on its own; you have to invite the SDK into your app. Install the web SDK, give it the connection string and load it, and page views and exceptions start flowing. Don't mix this up with pa telemetry, which is about the CLI's own usage data.
Full Explanation
Code apps are standard single-page applications, so client telemetry comes from the Application Insights JavaScript SDK. The developer installs the @microsoft/applicationinsights-web package, creates an ApplicationInsights instance with the resource's connection string, calls loadAppInsights and calls trackPageView where views should be recorded. The SDK also collects unhandled exceptions by default once loaded. The client library additionally lets the app register a logger through setConfig so platform metrics such as session load and network request summaries can be forwarded to the same resource. pa telemetry enable and disable control whether the Power Apps CLI itself sends usage telemetry to Microsoft; they do not instrument the app. There is no maker portal field that turns on Application Insights for a code app; that pattern resembles the canvas app instrumentation key setting and does not apply here. A connector data source that writes log rows from each component is not how browser telemetry is captured and would add requests to every page load. Exam caveat: if CSP is enforced, the ingestion endpoints must be allowed in connect-src or telemetry is blocked. Operational check: deploy, open the app, and query the pageViews and exceptions tables in the Application Insights logs to confirm data arrives.