
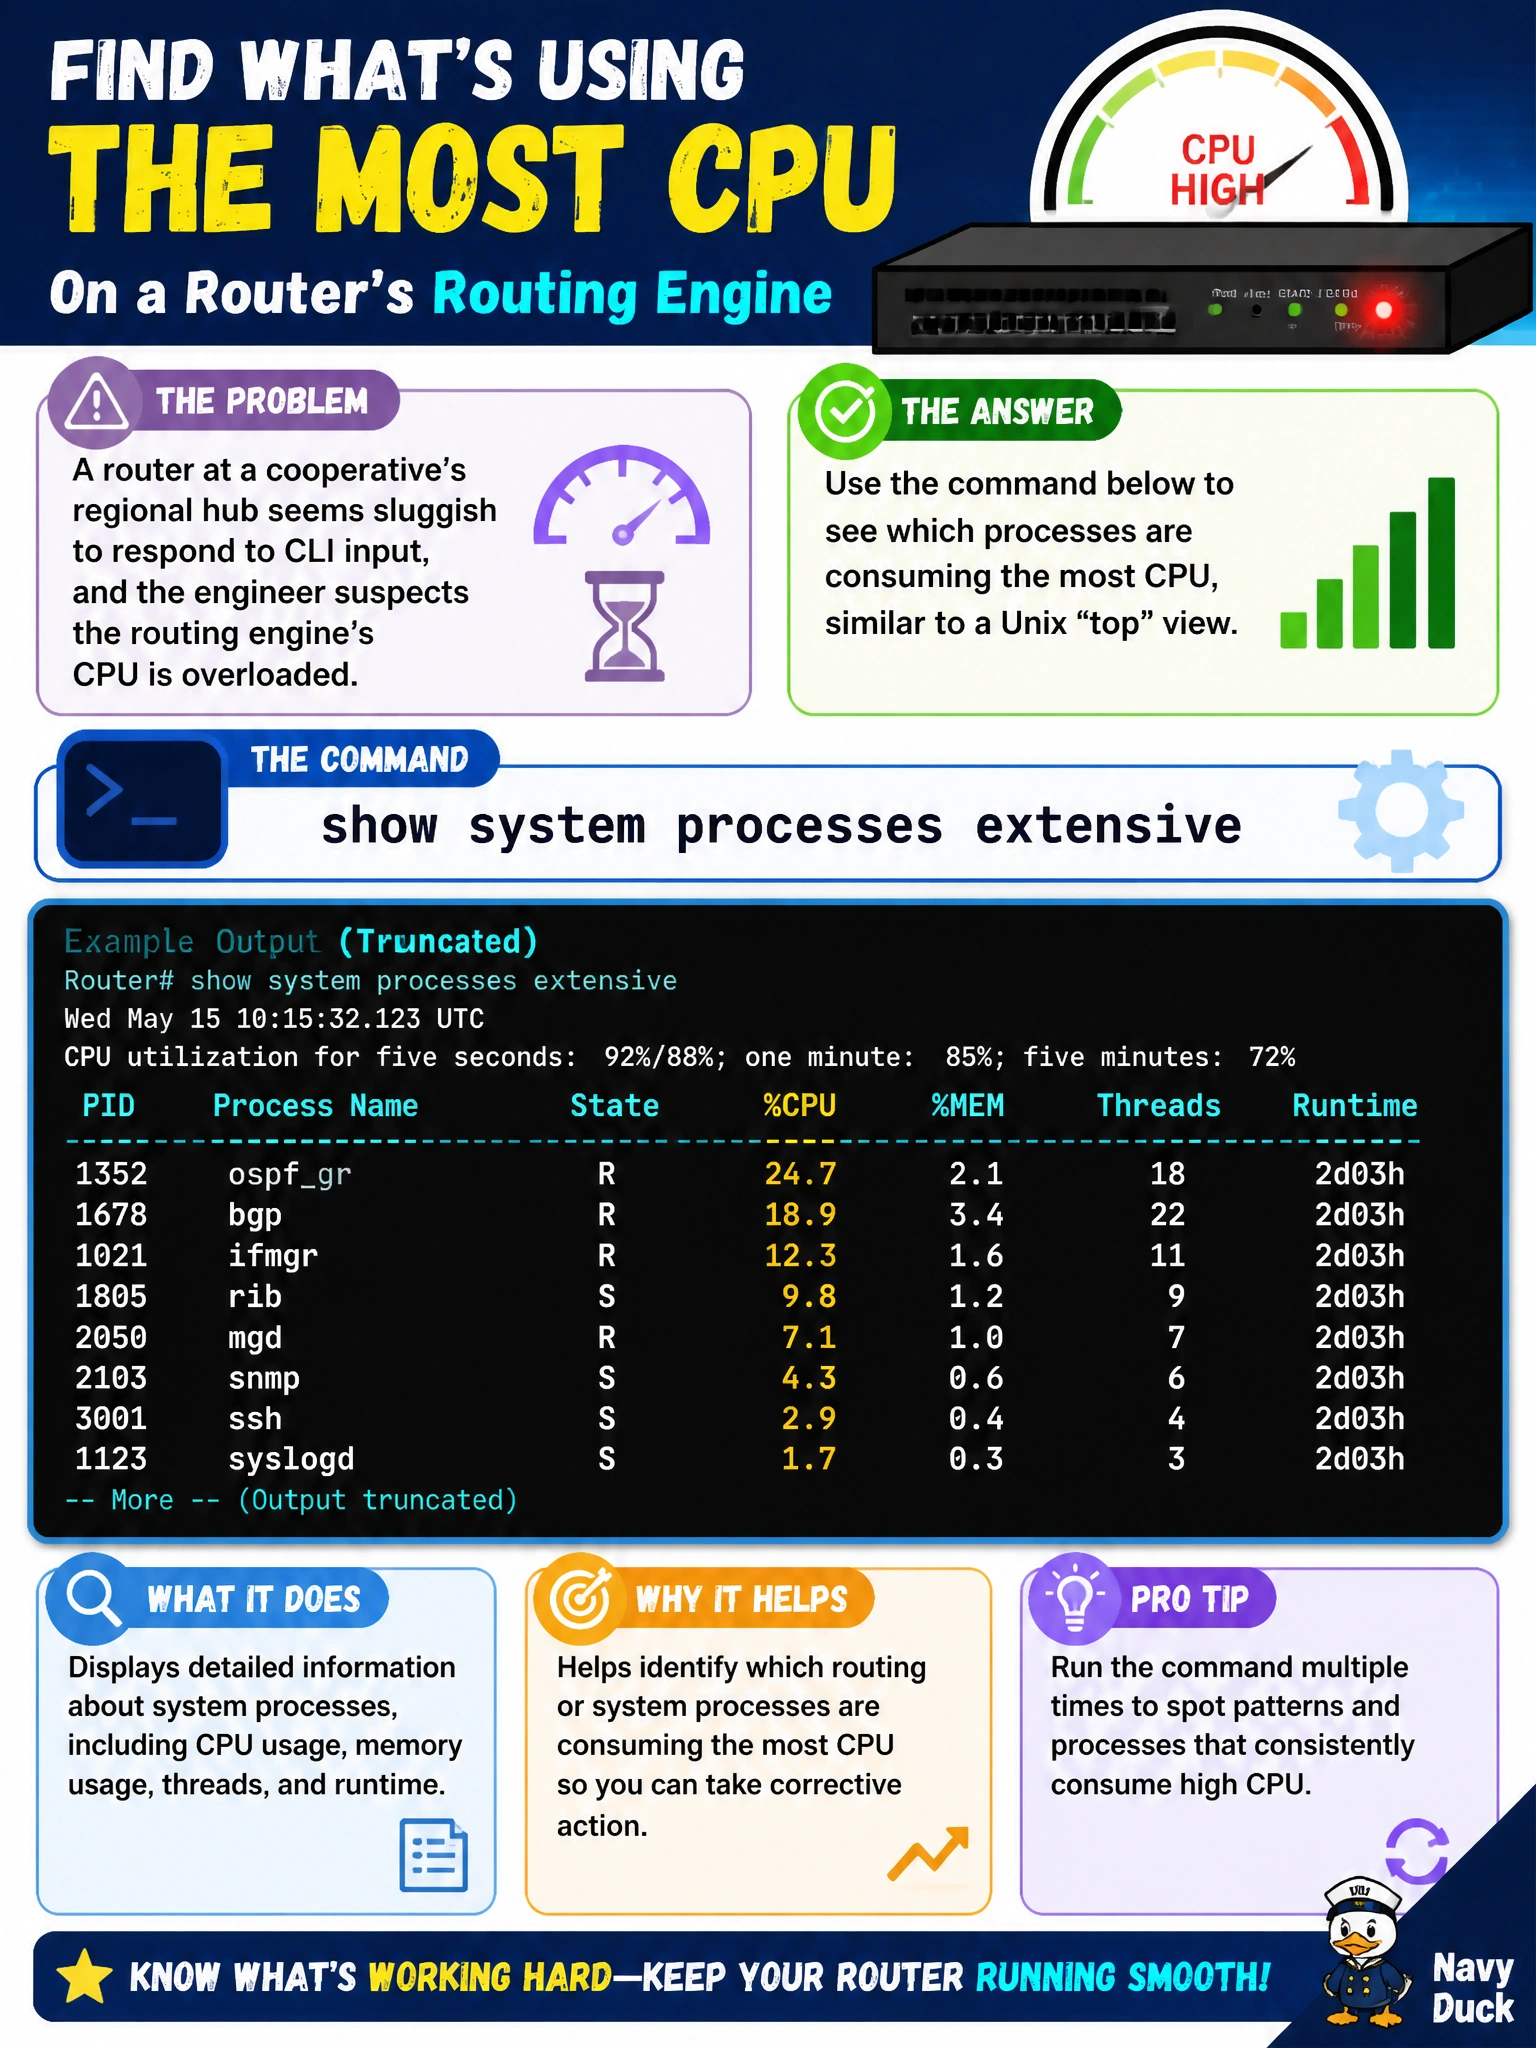
A router at a cooperative's regional hub seems sluggish to respond to CLI input, and the engineer suspects the routing engine's CPU is overloaded. Which command lets the engineer see which processes are consuming the most CPU, similar to a Unix top view?
Select an answer to reveal the explanation.
Short Explanation
When the router feels slow to respond, you want the same thing a sysadmin wants on a laggy Linux box: a live, sortable list of what's actually eating the CPU. show system processes extensive is that list, refreshing on the screen much like top does.
Full Explanation
show system processes extensive presents a continuously-updating, per-process breakdown of CPU and memory consumption on the routing engine, letting the engineer see immediately which daemon or task is responsible for the sluggishness — the direct equivalent of running top on a Unix host. show chassis routing-engine is a closely related but coarser tool: it reports overall routing-engine health, including aggregate CPU utilization over 5-second, 1-minute, and 5-minute intervals, temperature, and memory, which confirms that the CPU is indeed busy but doesn't identify which individual process is driving that load. show interfaces extensive reports per-interface traffic and error counters and has no visibility into routing-engine process activity at all, so it can't help diagnose a CPU bottleneck. show system storage reports filesystem disk usage, a completely separate resource from CPU. A useful caveat: a brief CPU spike during a routing convergence event is normal and not itself evidence of a problem — sustained high utilization over minutes is the pattern worth escalating. A concrete check: run show system processes extensive, sort by CPU, and confirm whether the top consumer is an expected process (like an SNMP poll) or something unexpected.