
An information security manager compiles monthly risk metrics by hand from spreadsheets that each regional office maintains differently, and the figures often change after they have been reported. What should the manager address FIRST to make the metrics useful to management?
Select an answer to reveal the explanation.
Short Explanation
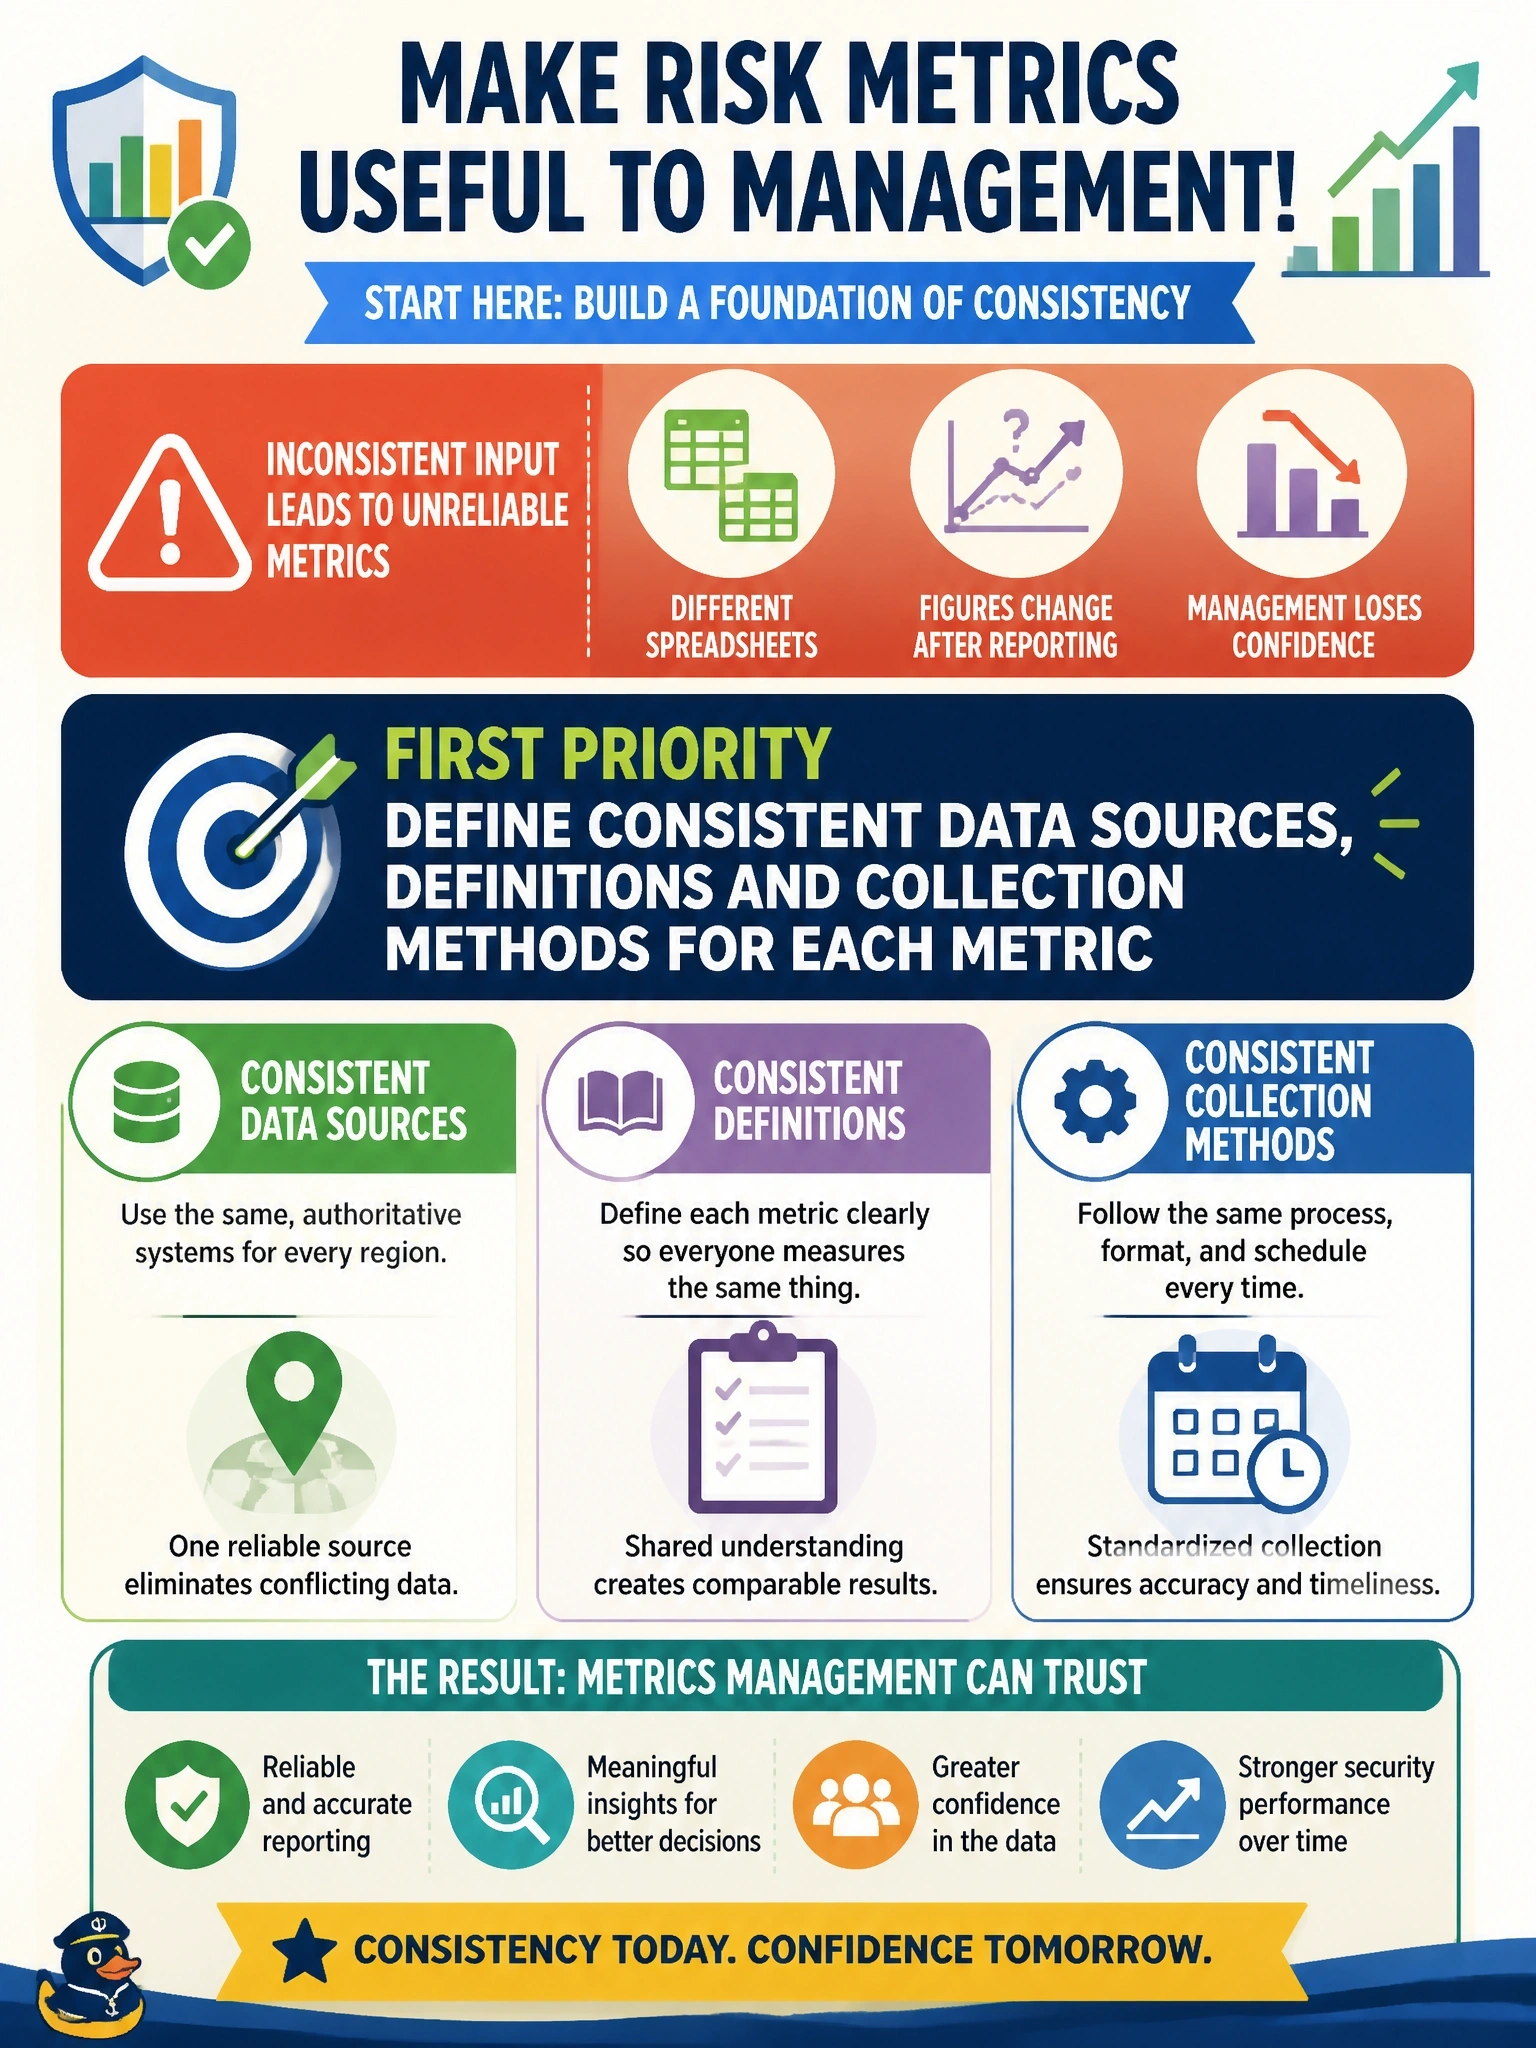
If every office uses its own ruler, you can't compare the measurements, no matter how pretty the chart is. Reliable metrics start with reliable data. The trap is polishing the presentation or adding volume when you can't trust the inputs themselves.
Full Explanation
A metric is only as credible as its data. When each region keeps its records differently and figures are revised after reporting, management cannot trust trends or compare offices, and decisions built on the numbers may be wrong. The first step is to define, for each metric, the authoritative source, a precise definition of what is counted, the collection method and timing, and an owner, ideally with automated extraction where practical. That makes results repeatable and comparable. A visual dashboard improves readability but simply displays unreliable numbers more attractively, which can increase false confidence. Weekly reporting multiplies the manual effort and the opportunities for inconsistency without fixing the cause of the errors. Adding more metrics does not make any of them more accurate; averaging inconsistent inputs produces a figure that is precise-looking but meaningless, and it dilutes the attention of the audience. Exam caveat: CISM treats metric quality attributes such as accuracy, consistency, timeliness and cost-effectiveness as prerequisites for useful reporting. Operational check: document a metric definition sheet for each reported metric, have each region confirm it collects to that definition, and track how often reported values are revised as an indicator of data quality.