
A quantitative analyst is building a contrarian signal model using short interest data from FINRA. She notices that stocks with short interest exceeding 30% of float have historically produced positive abnormal returns over the following 60 days in her backtest. Which mechanism MOST directly explains this phenomenon, and which risk must her model explicitly account for?
Select an answer to reveal the explanation.
Short Explanation
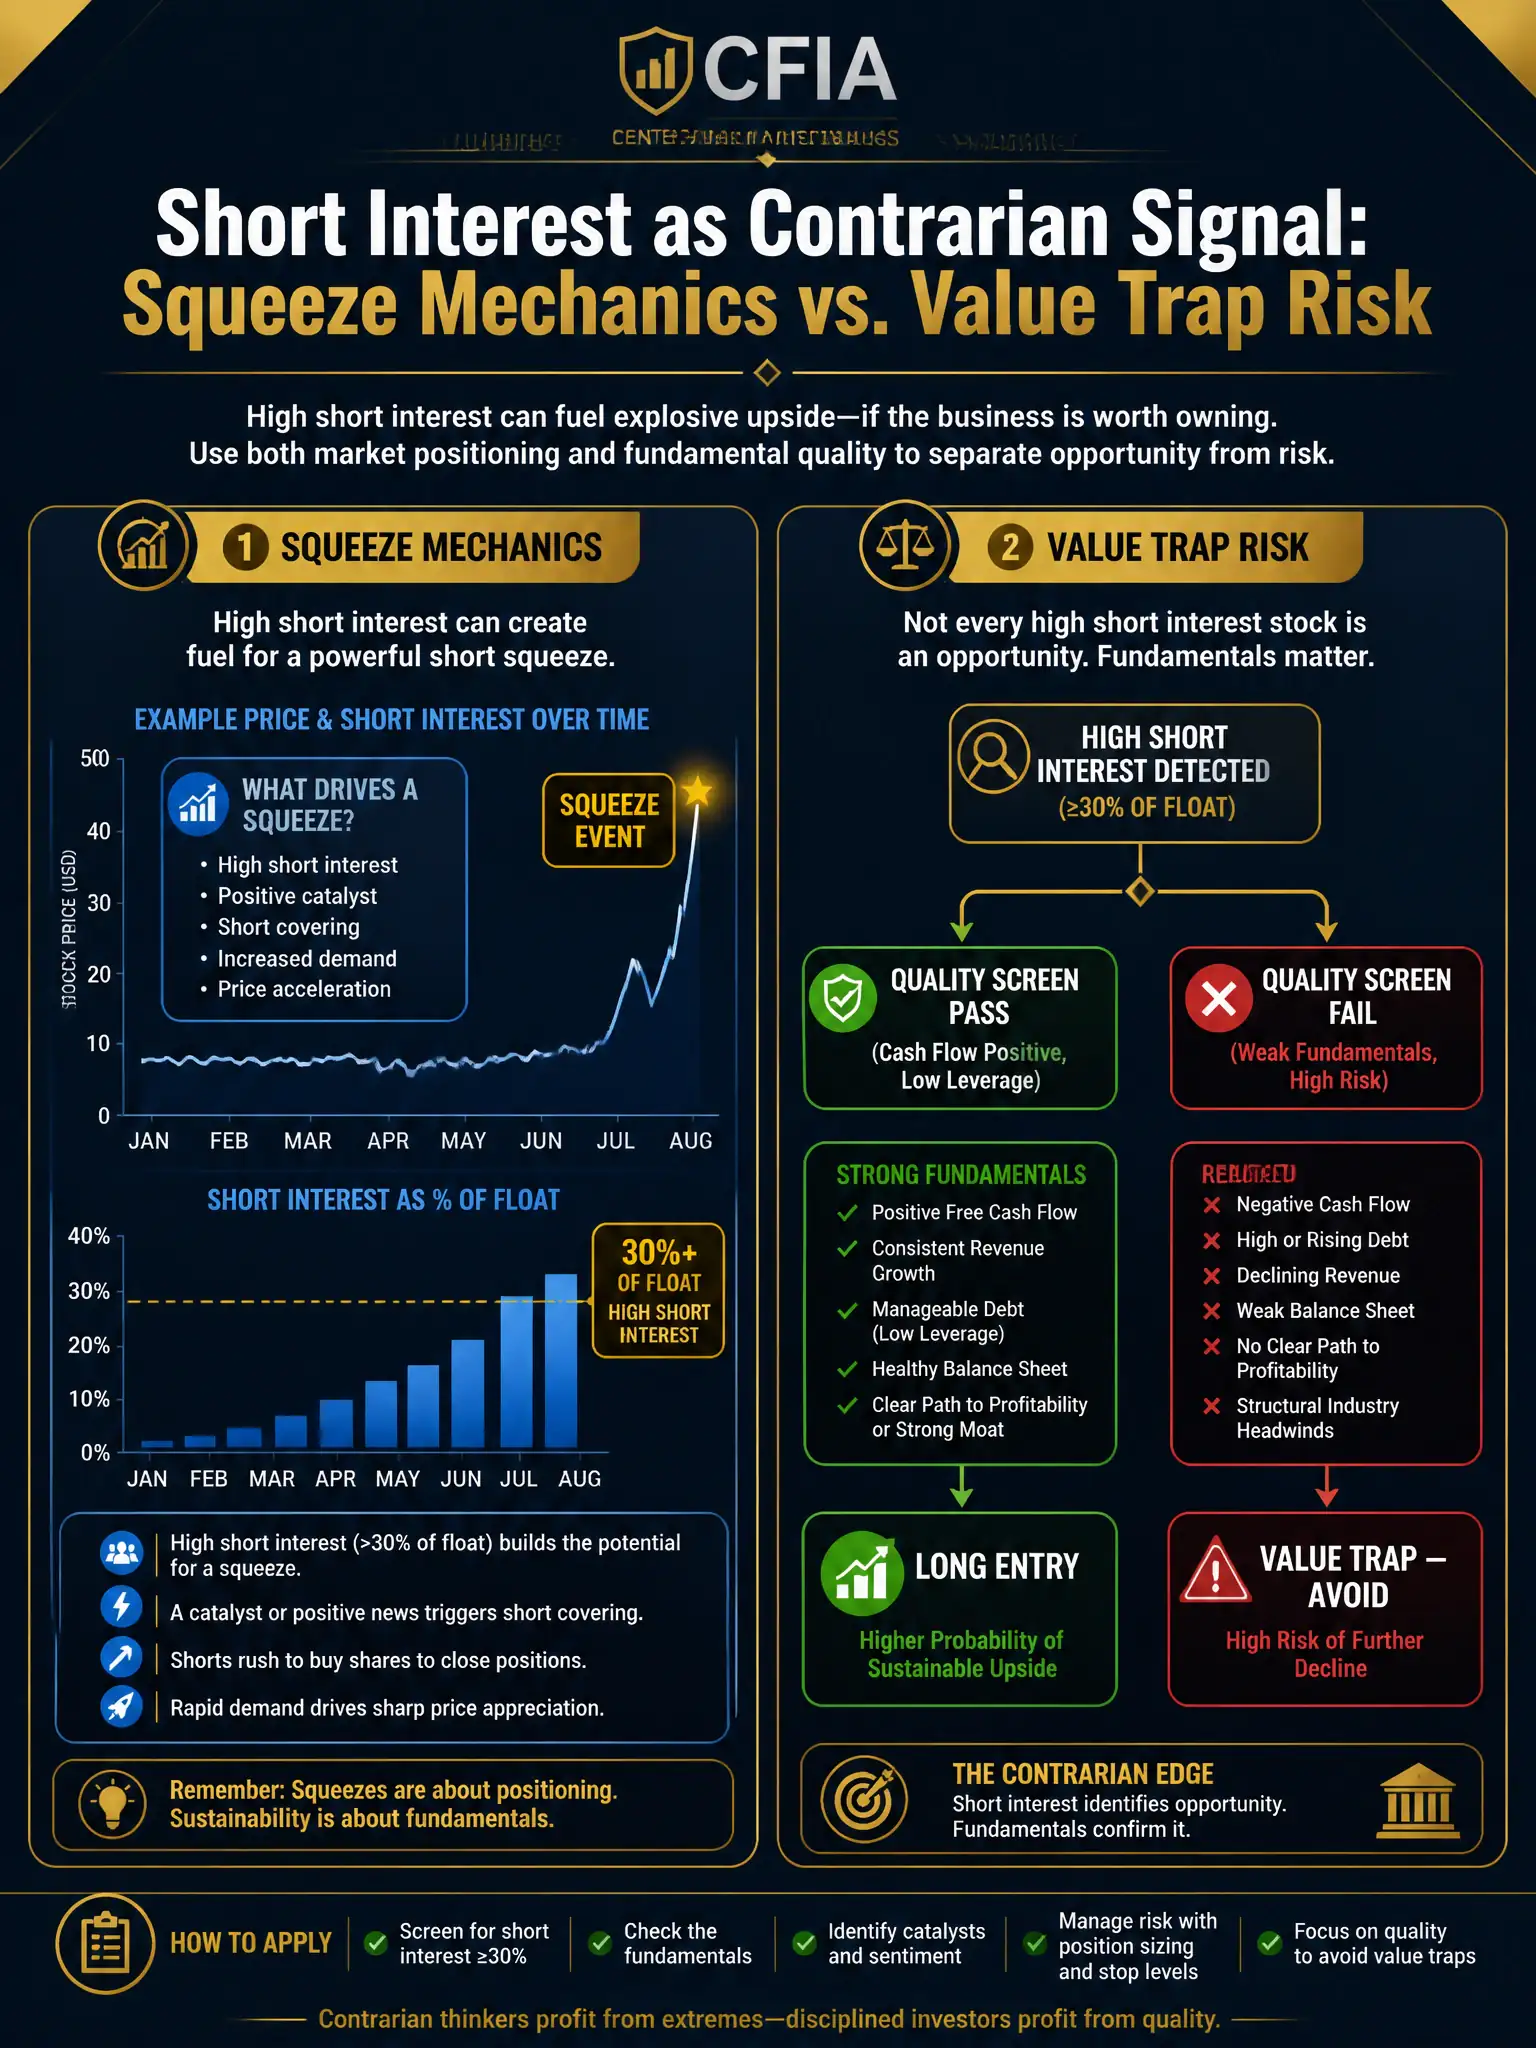
Picture a crowded fire exit: when bad news clears and the crowd tries to reverse, the exit is too small for everyone at once, and prices spike violently upward. High short interest is that crowded exit. You need to know the difference between a squeeze setup and a zombie company with a permanently impaired business model, because the latter will punish your contrarian bet indefinitely.
Full Explanation
The correct mechanism is the short-squeeze mechanism driven by forced short-covering when positive catalysts emerge. When short interest as a percentage of float is elevated, a significant portion of outstanding shares have been borrowed and sold by investors expecting the price to decline. If the stock receives an unexpected positive catalyst, such as a strong earnings print, a buyout bid, or a favorable regulatory ruling, short-sellers face mounting mark-to-market losses and margin calls that force them to buy shares to cover. Because many shorts must buy simultaneously in a thin market, prices spike sharply, rewarding any long investor who entered before the squeeze. The contrarian alpha in high-short-interest strategies is well documented in academic literature, including Asquith, Pathak, and Ritter, 2005, and Cohen, Diether, and Malloy, 2007. The signal works because short-sellers, while sophisticated, often over-crowd into popular bearish theses and face structural disadvantages, including borrow costs, recall risk, and margin constraints, that force exits independent of their original investment thesis. The correct primary risk is value traps. High short interest also legitimately flags companies with declining fundamentals: deteriorating revenue, rising leverage, or disruptive competitive threats. Naive contrarian models that buy all high-short-interest names will hold through prolonged drawdowns in companies like retailers facing secular decline or energy companies in commodity downturns. Robust models incorporate fundamental quality screens, such as cash flow adequacy and debt-to-equity thresholds, to distinguish squeeze candidates from falling knives. The insider-buying pressure explanation, which attributes the signal to insider buying and warns of SEC enforcement actions against the fund for trading on material non-public information, is wrong because it misattributes the signal and introduces a legal red herring; short interest data is public information published by FINRA, so trading on it carries no material non-public information risk. The securities-lending collateral explanation, which frames high short interest as institutional demand for shares as collateral in securities lending programs and prime broker counterparty exposure, is wrong because it confuses securities lending mechanics with price signal interpretation. The liquidity-risk small-cap explanation, which attributes the premium to liquidity risk unique to thinly traded small-caps and recommends filtering out all names with market cap above $500M, is wrong because it conflates a specific market-cap filter with the underlying mechanism, and the assumption is empirically false, since short-squeeze dynamics are well documented in mid- and large-cap names.