
A global macro fund deploys an AI system to detect supply chain disruptions before they manifest in company earnings. The system must process heterogeneous data feeds in near-real-time. Which data fusion strategy provides the most robust early-warning capability?
Select an answer to reveal the explanation.
Short Explanation
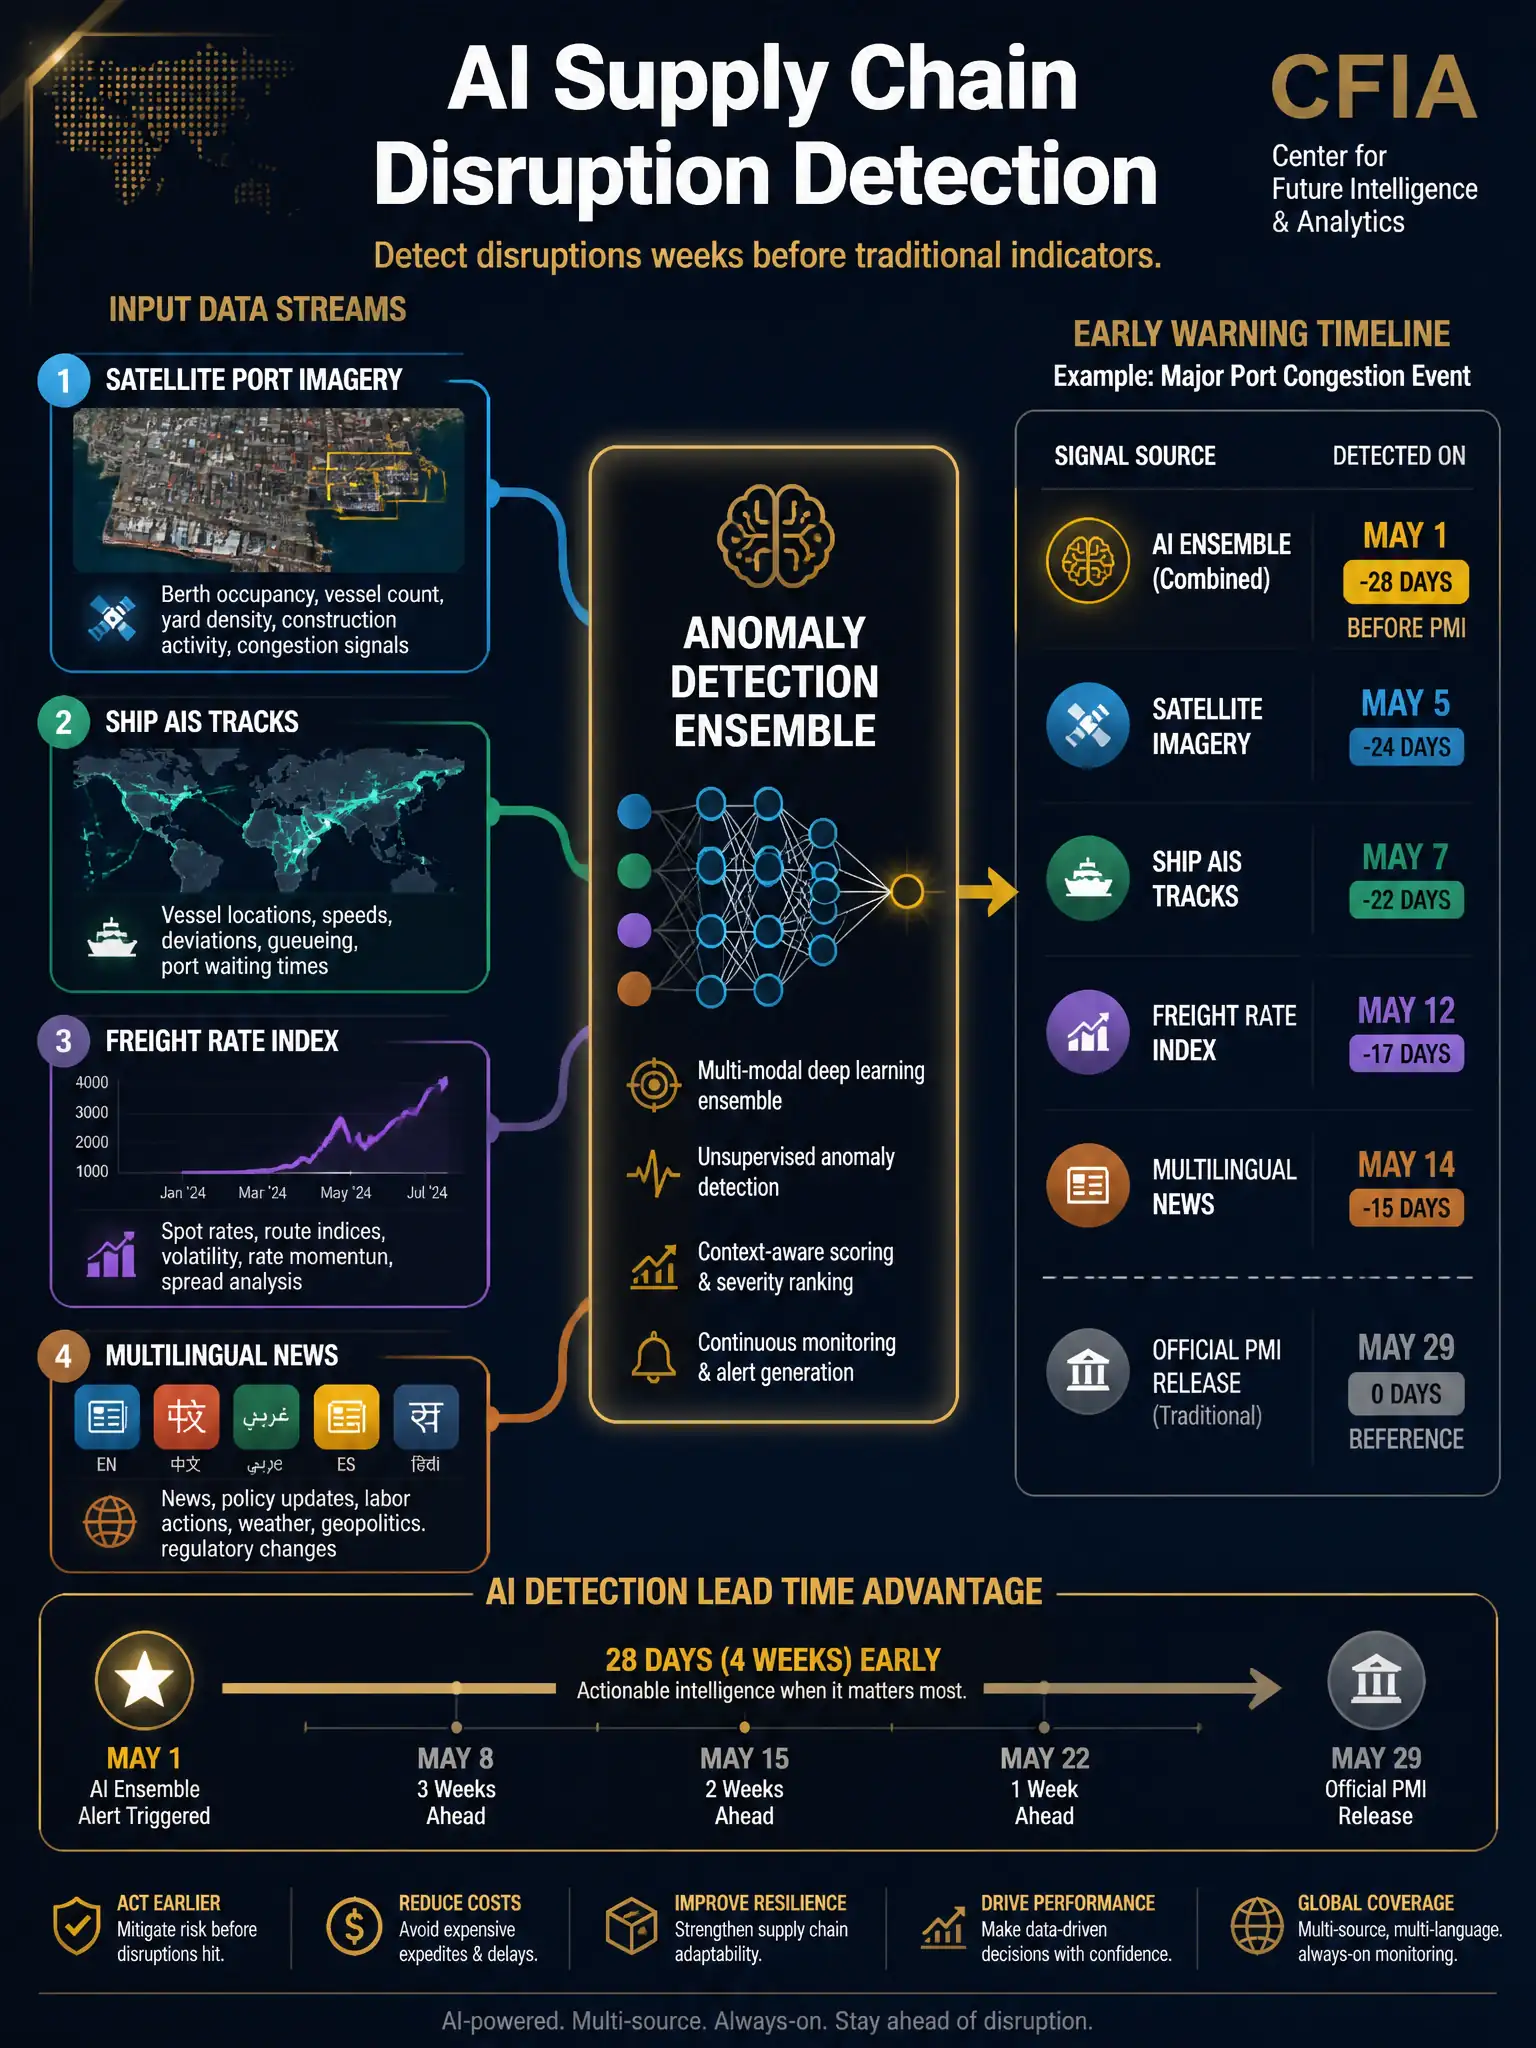
You need to watch the whole supply-chain ecosystem, not one noisy indicator. Fusing port imagery, vessel tracking, freight rates, and multilingual supplier news lets you spot anomalies before earnings or surveys catch up.
Full Explanation
Supply chain disruption detection is a canonical multi-modal AI problem because disruptions propagate across physical, financial, and informational channels at different speeds. The fund's goal is to detect the disruption as close to its origin as possible, not when it appears in earnings calls or monthly macro surveys. The satellite imagery, AIS vessel tracking, air freight rate indices, and multilingual NLP fusion strategy is the most robust early-warning approach because it implements a multi-layer view of the supply chain. Satellite imagery provides direct physical evidence of port congestion with no reporting lag. AIS vessel tracking identifies vessels sitting at anchor or deviating from normal routes in real time. Air freight rate spikes, such as those from the Baltic Air Freight Index or Xeneta, indicate shippers are paying emergency premiums to bypass sea lanes. NLP across multiple languages captures supplier distress announcements from local news sources that English-only systems miss, which is a critical edge when disruptions originate in non-English-speaking manufacturing hubs. Fusing these heterogeneous signals through an anomaly detection ensemble model that learns normal seasonal patterns allows statistically significant deviation detection days to weeks before conventional indicators move. The logistics-equity-only approach is a lagging or coincident signal at best. Efficient markets may partially reflect disruptions, but equity prices incorporate many other factors including sector rotation, rate expectations, and earnings revisions. Using logistics equity prices as the primary signal sacrifices the informational edge that alternative data provides. The ISM Purchasing Managers Index primary-source approach has a critical latency problem: PMI data is released monthly with a multi-week lag behind the survey period. Disruptions that begin in week one of a month won't appear in the PMI until four to six weeks later, well after the optimal trading window has closed. PMI also relies on self-reported survey data, introducing subjectivity and potential manipulation. The commodity futures-curve inversion approach captures price stress in input materials but says nothing about physical logistics chokepoints, geographic concentration risk, or which specific downstream manufacturers are exposed. Backwardation in an oil curve may reflect demand destruction rather than supply disruption.