
A quantitative investment firm deployed an AI-powered earnings call analysis tool 12 months ago. The CFO asks the CFIA-credentialed Head of AI Strategy to present a rigorous ROI measurement framework to the board. The tool has reduced analyst time per earnings call from 4 hours to 45 minutes, improved signal identification rate by 22%, but required $1.2M in annual infrastructure and licensing costs. Which ROI measurement framework BEST captures the full value and cost picture for this AI deployment?
Select an answer to reveal the explanation.
Short Explanation
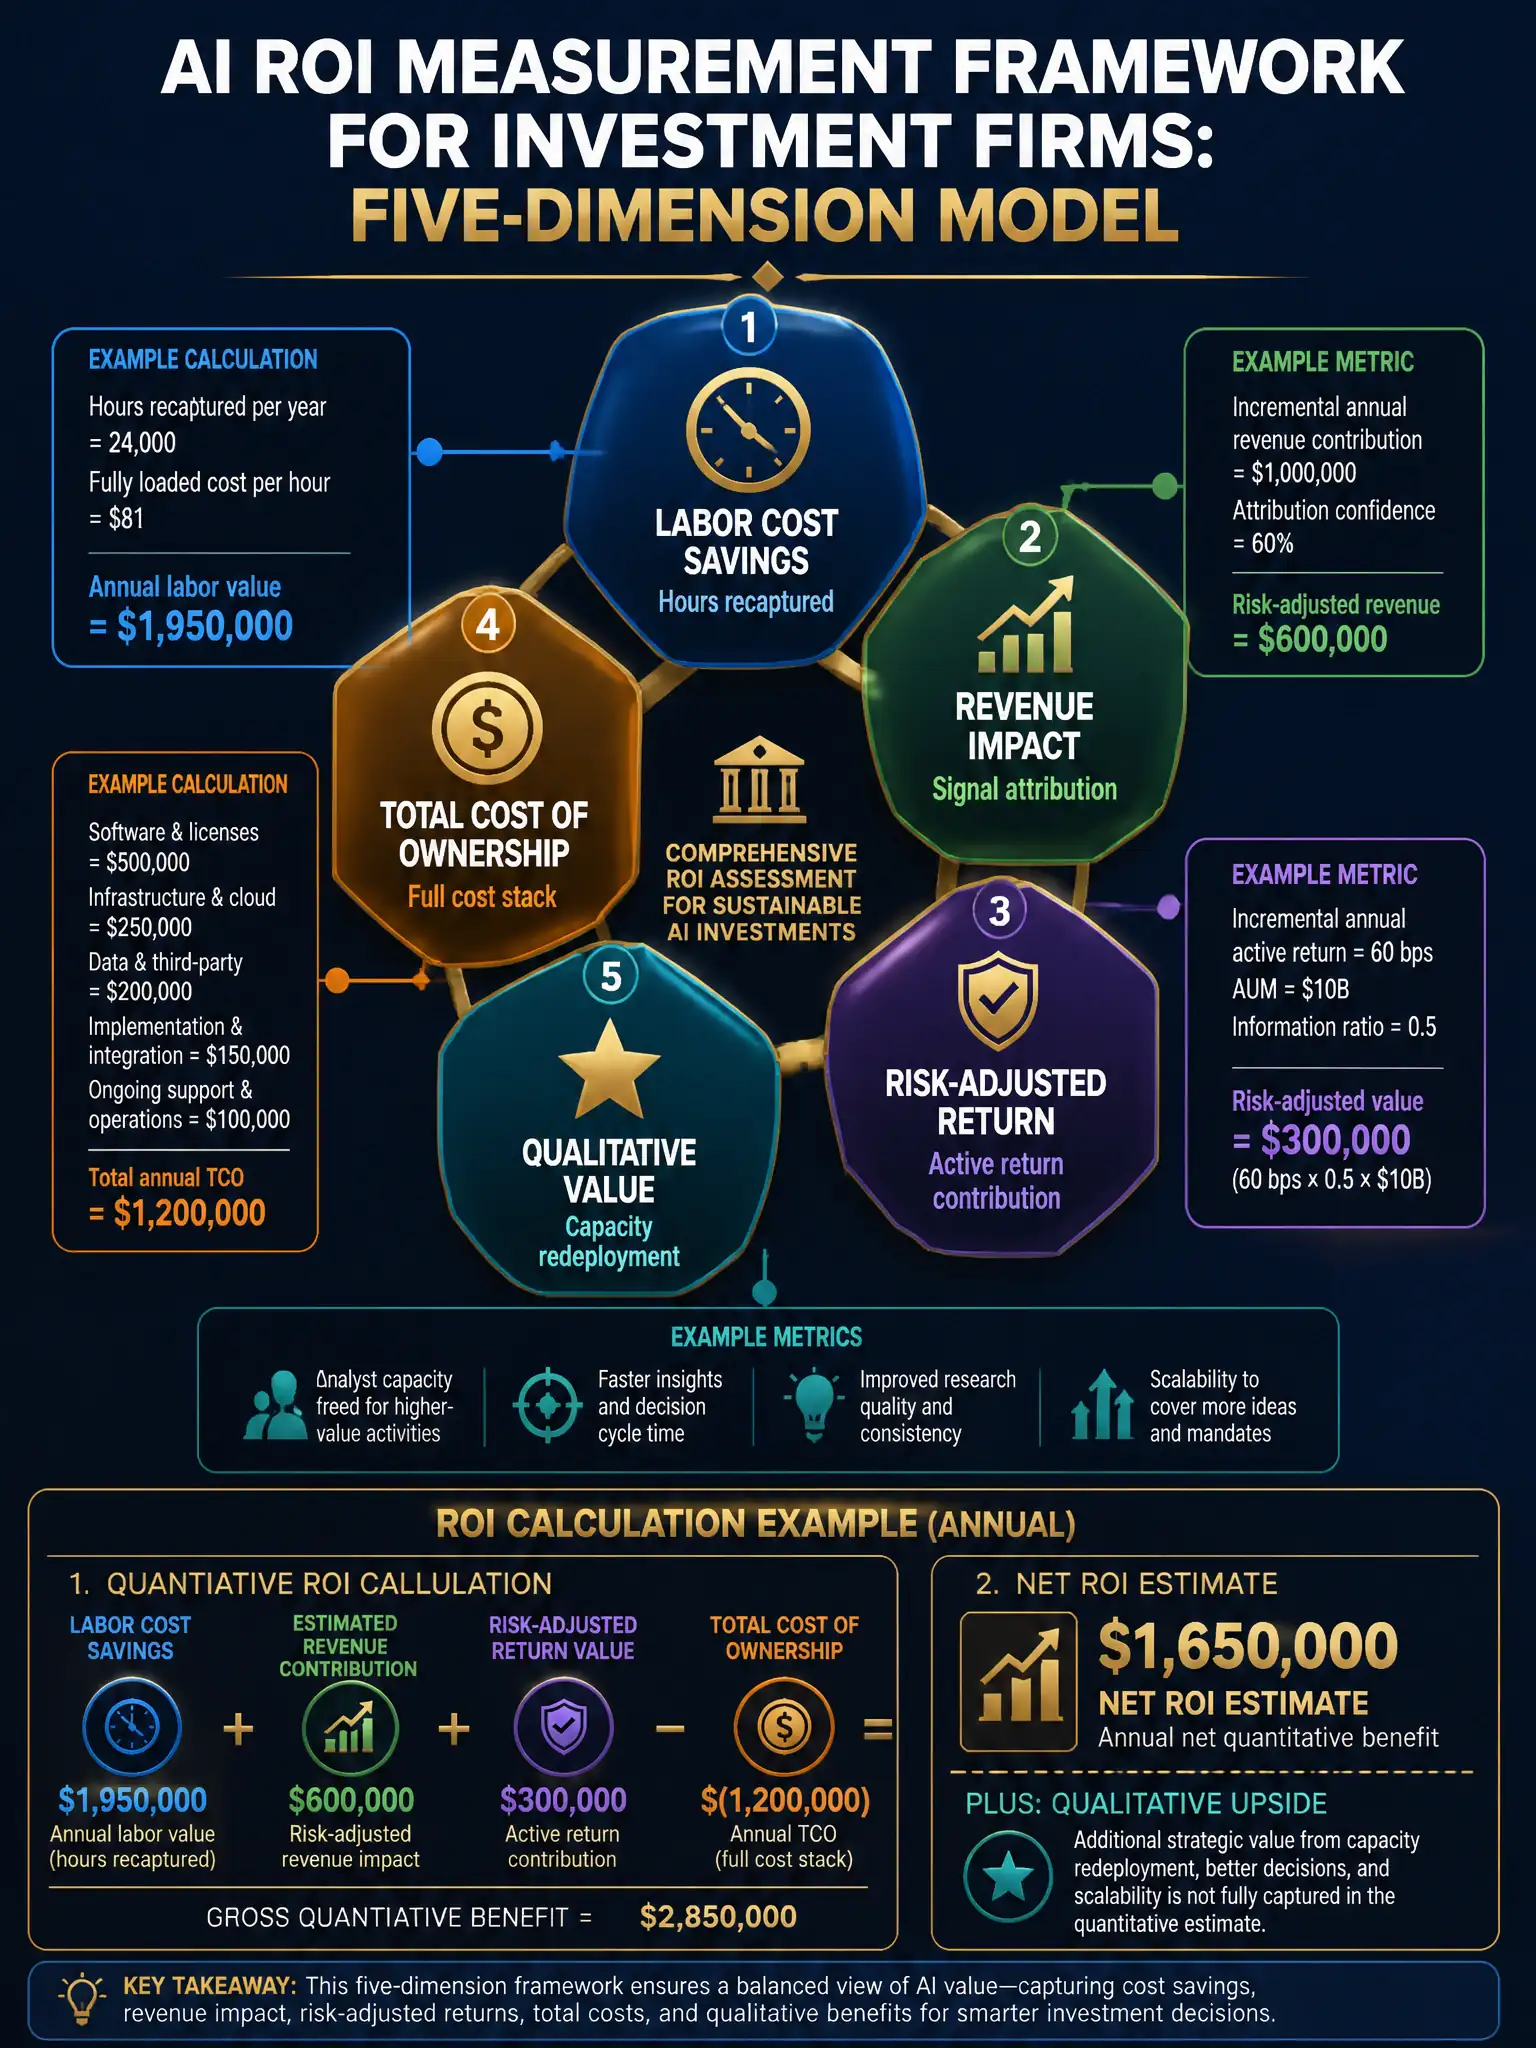
You don't just count how fast the tool reads earnings calls; you measure what it found, what it was worth, and whether it freed your senior analysts for higher-value work. The right framework captures labor savings, revenue impact, risk-adjusted return, full costs, and qualitative strategic value. Any single-dimension measure will understate or misstate the true case.
Full Explanation
AI ROI measurement in investment management requires a framework that reflects the multi-layered value creation and cost mechanisms unique to financial intelligence tools. A single-metric approach — whether cost savings, model accuracy, or revenue attribution — will produce a misleading picture that either oversells or undersells the technology's contribution. Direct labor cost savings are the most tangible starting point: if the tool reduces analyst time per earnings call from 4 hours to 45 minutes, a 3.25-hour saving per call, and the firm covers 500 earnings calls per quarter, that is 1,625 analyst hours per quarter freed, quantifiable at fully-loaded analyst compensation rates. For a senior analyst at $300/hour fully loaded, this is roughly $1.95M in annual labor value recaptured. Revenue impact from improved signal quality requires attribution modeling. A 22% improvement in signal identification rate must be linked to portfolio outcomes, including which positions sourced from AI-enhanced analysis outperformed and what the contribution to active return was. This requires integrating the AI system's signal provenance data with the portfolio management system's attribution outputs. Even a partial attribution, such as AI-sourced signals contributing 0.3% of 1.8% active return, creates a defensible revenue case. Risk-adjusted return contribution adjusts the revenue impact for the incremental risk taken to achieve it. A higher signal identification rate that leads to higher-conviction positions may also reduce average holding period volatility, and this should be measured using the firm's existing risk attribution framework, such as factor models and scenario analysis. Total cost of ownership must capture not just infrastructure and licensing, including the stated $1.2M, but also internal engineering time, data licensing fees specific to the AI use case, compliance review costs, and opportunity cost of capital deployed. Qualitative metrics, including analyst satisfaction, capacity redeployment to higher-value tasks, and competitive differentiation in client pitches, complete the board-level narrative. The correct framework is the one that quantifies direct labor cost savings from time reduction, revenue impact from improved signal quality and coverage expansion, risk-adjusted return contribution from the signal improvement, total cost of ownership including infrastructure, licensing, and maintenance, and qualitative value metrics such as analyst capacity redeployment and competitive positioning. Calculating only infrastructure cost savings compared to the previous manual process captures only one cost dimension and ignores revenue, risk, and strategic value. Measuring only model accuracy metrics, such as F1 score, precision, and recall on held-out test datasets, conflates technical performance with business value. Deferring ROI measurement until a full three-year deployment cycle is complete is incorrect because 12 months of production data is sufficient to establish a credible ROI baseline, and deferring measurement undermines governance accountability.