
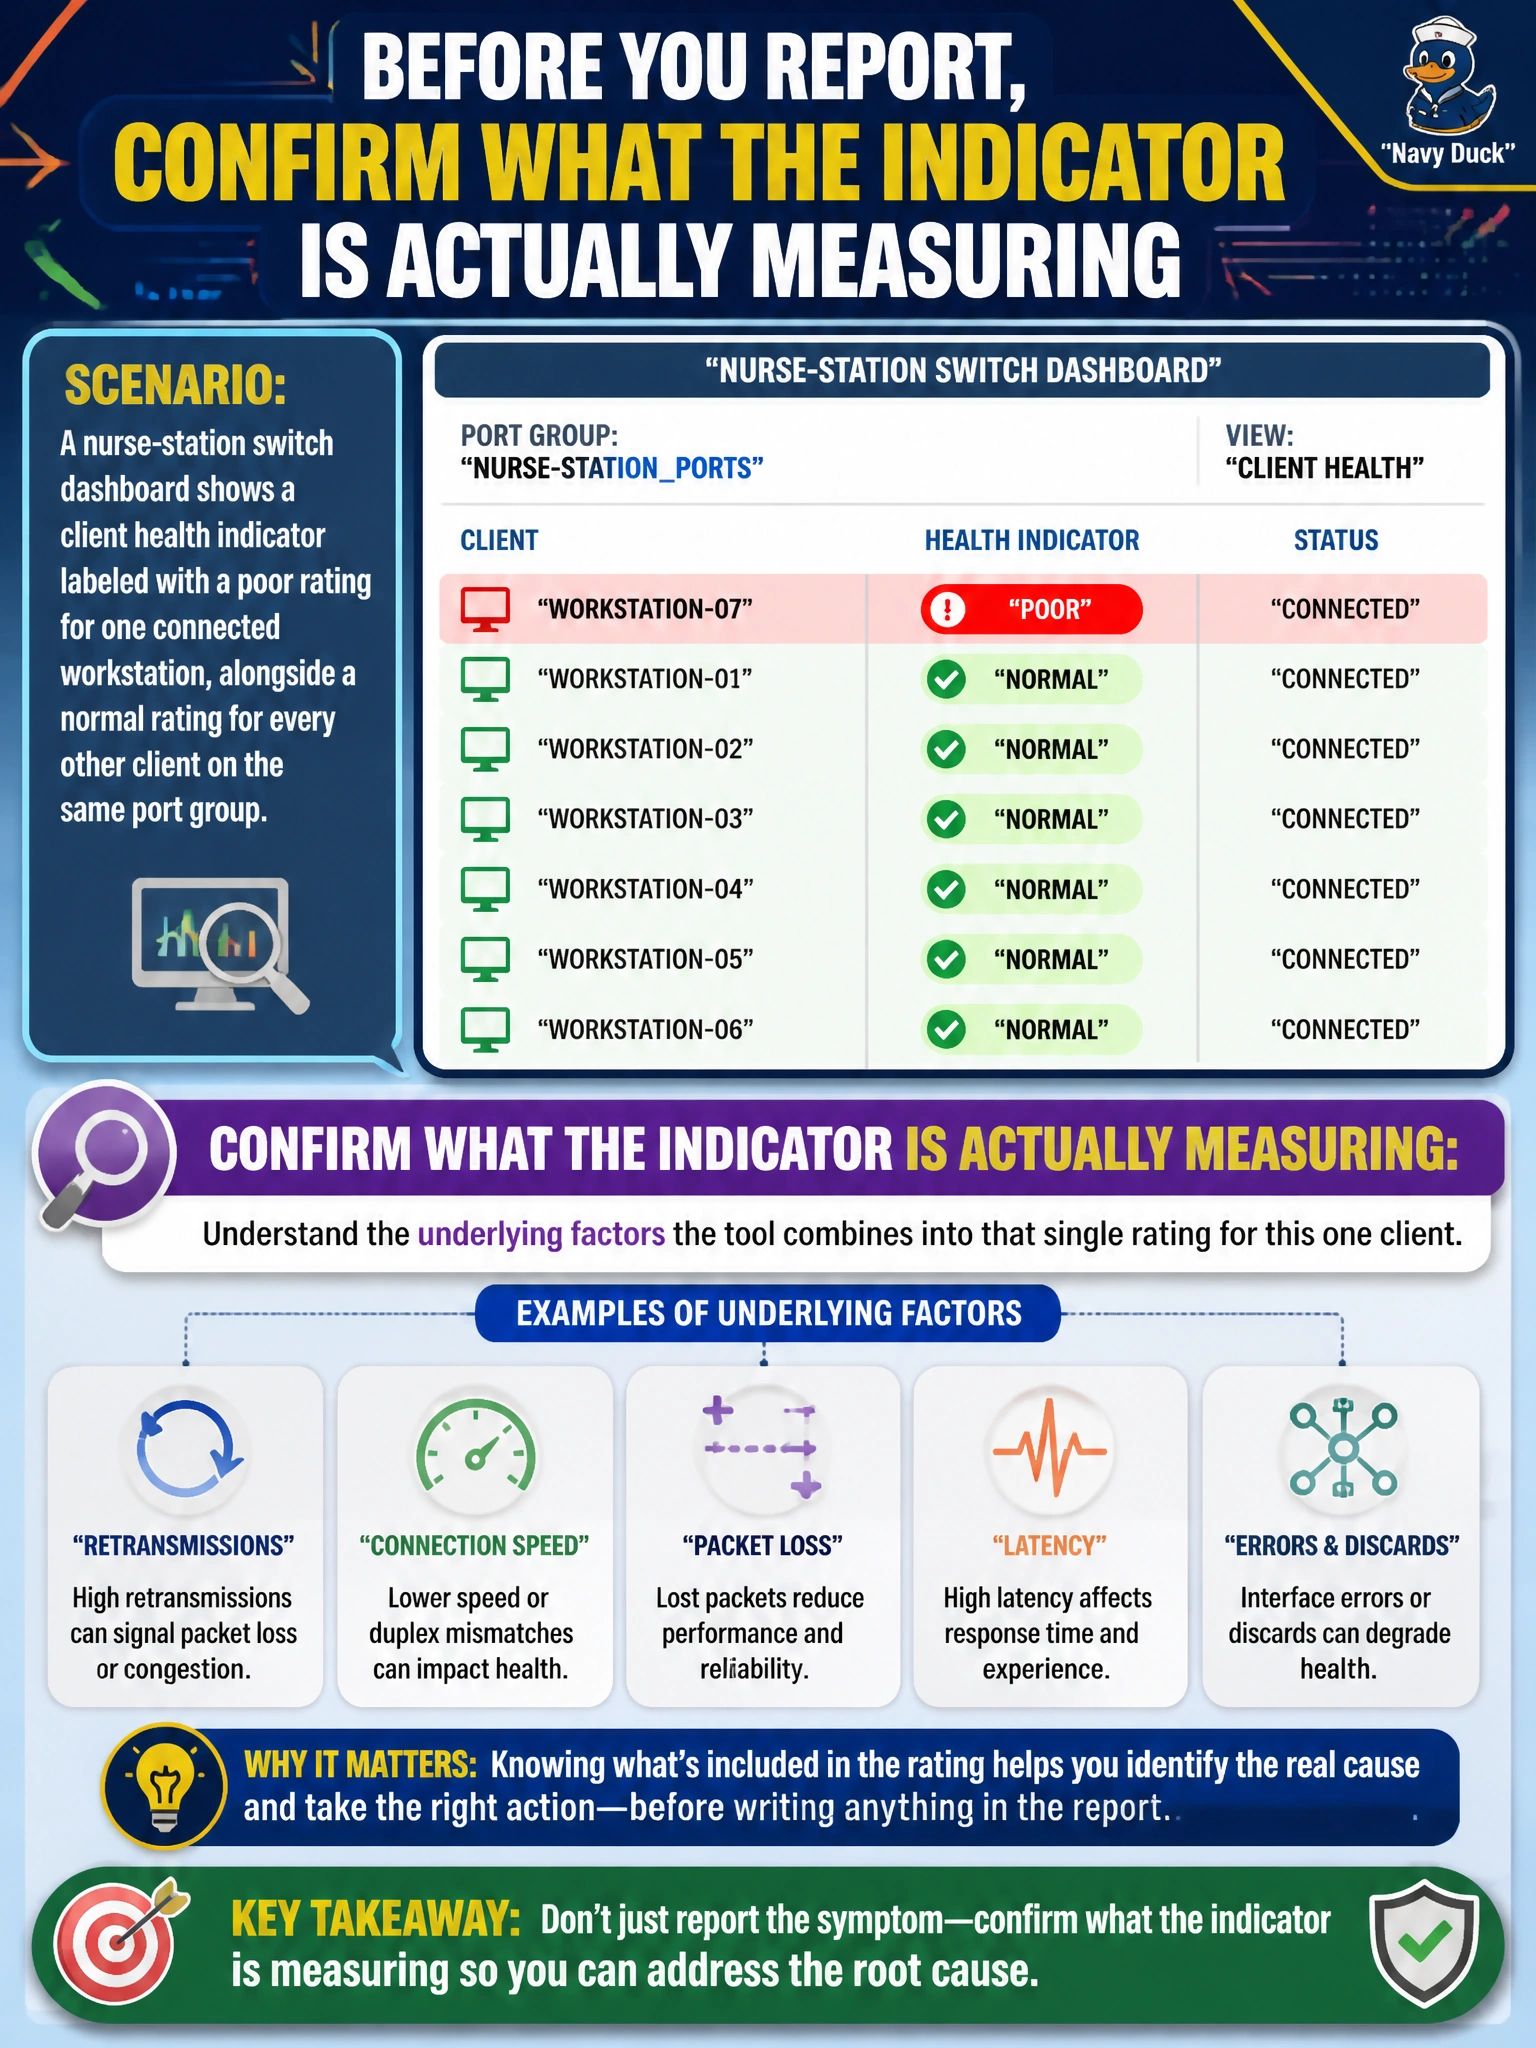
A nurse-station switch dashboard shows a client health indicator labeled with a poor rating for one connected workstation, alongside a normal rating for every other client on the same port group. Before writing anything into the report, what should the technician confirm the indicator is actually measuring?
Select an answer to reveal the explanation.
Short Explanation
A single-word rating like "poor" is a summary, not the full story. Before you write it down, you want to know what's actually being averaged into that word — kind of like checking what a report card grade is actually based on before repeating it to someone else.
Full Explanation
A client health indicator is typically a composite score built from several underlying signals, such as retransmission rates, negotiated link or connection speed, and error counts, so the responsible step before reporting a "poor" rating is to understand which of those factors are driving it for this particular client, since the same label can mean very different things depending on the cause. Whether the workstation happens to be powered on is a separate binary fact that a health rating does not directly convey, and a poor rating on an active client is not the same question as an up/down state. Free memory on the switch describes the switch's own resource health, an entirely different metric from a per-client indicator tied to one workstation's connection quality. Guest network oversubscription is unrelated to a wired nurse-station client's individual health score and belongs to a different network segment and a different kind of capacity concern. Understanding the composition of a composite metric matters because reporting "poor" without context gives the reader no actionable detail, while reporting that the client shows elevated retransmissions, for instance, actually describes a real condition. The concrete check here is to drill into that one client's detail view to see the contributing metrics before the rating goes into the weekly report.