
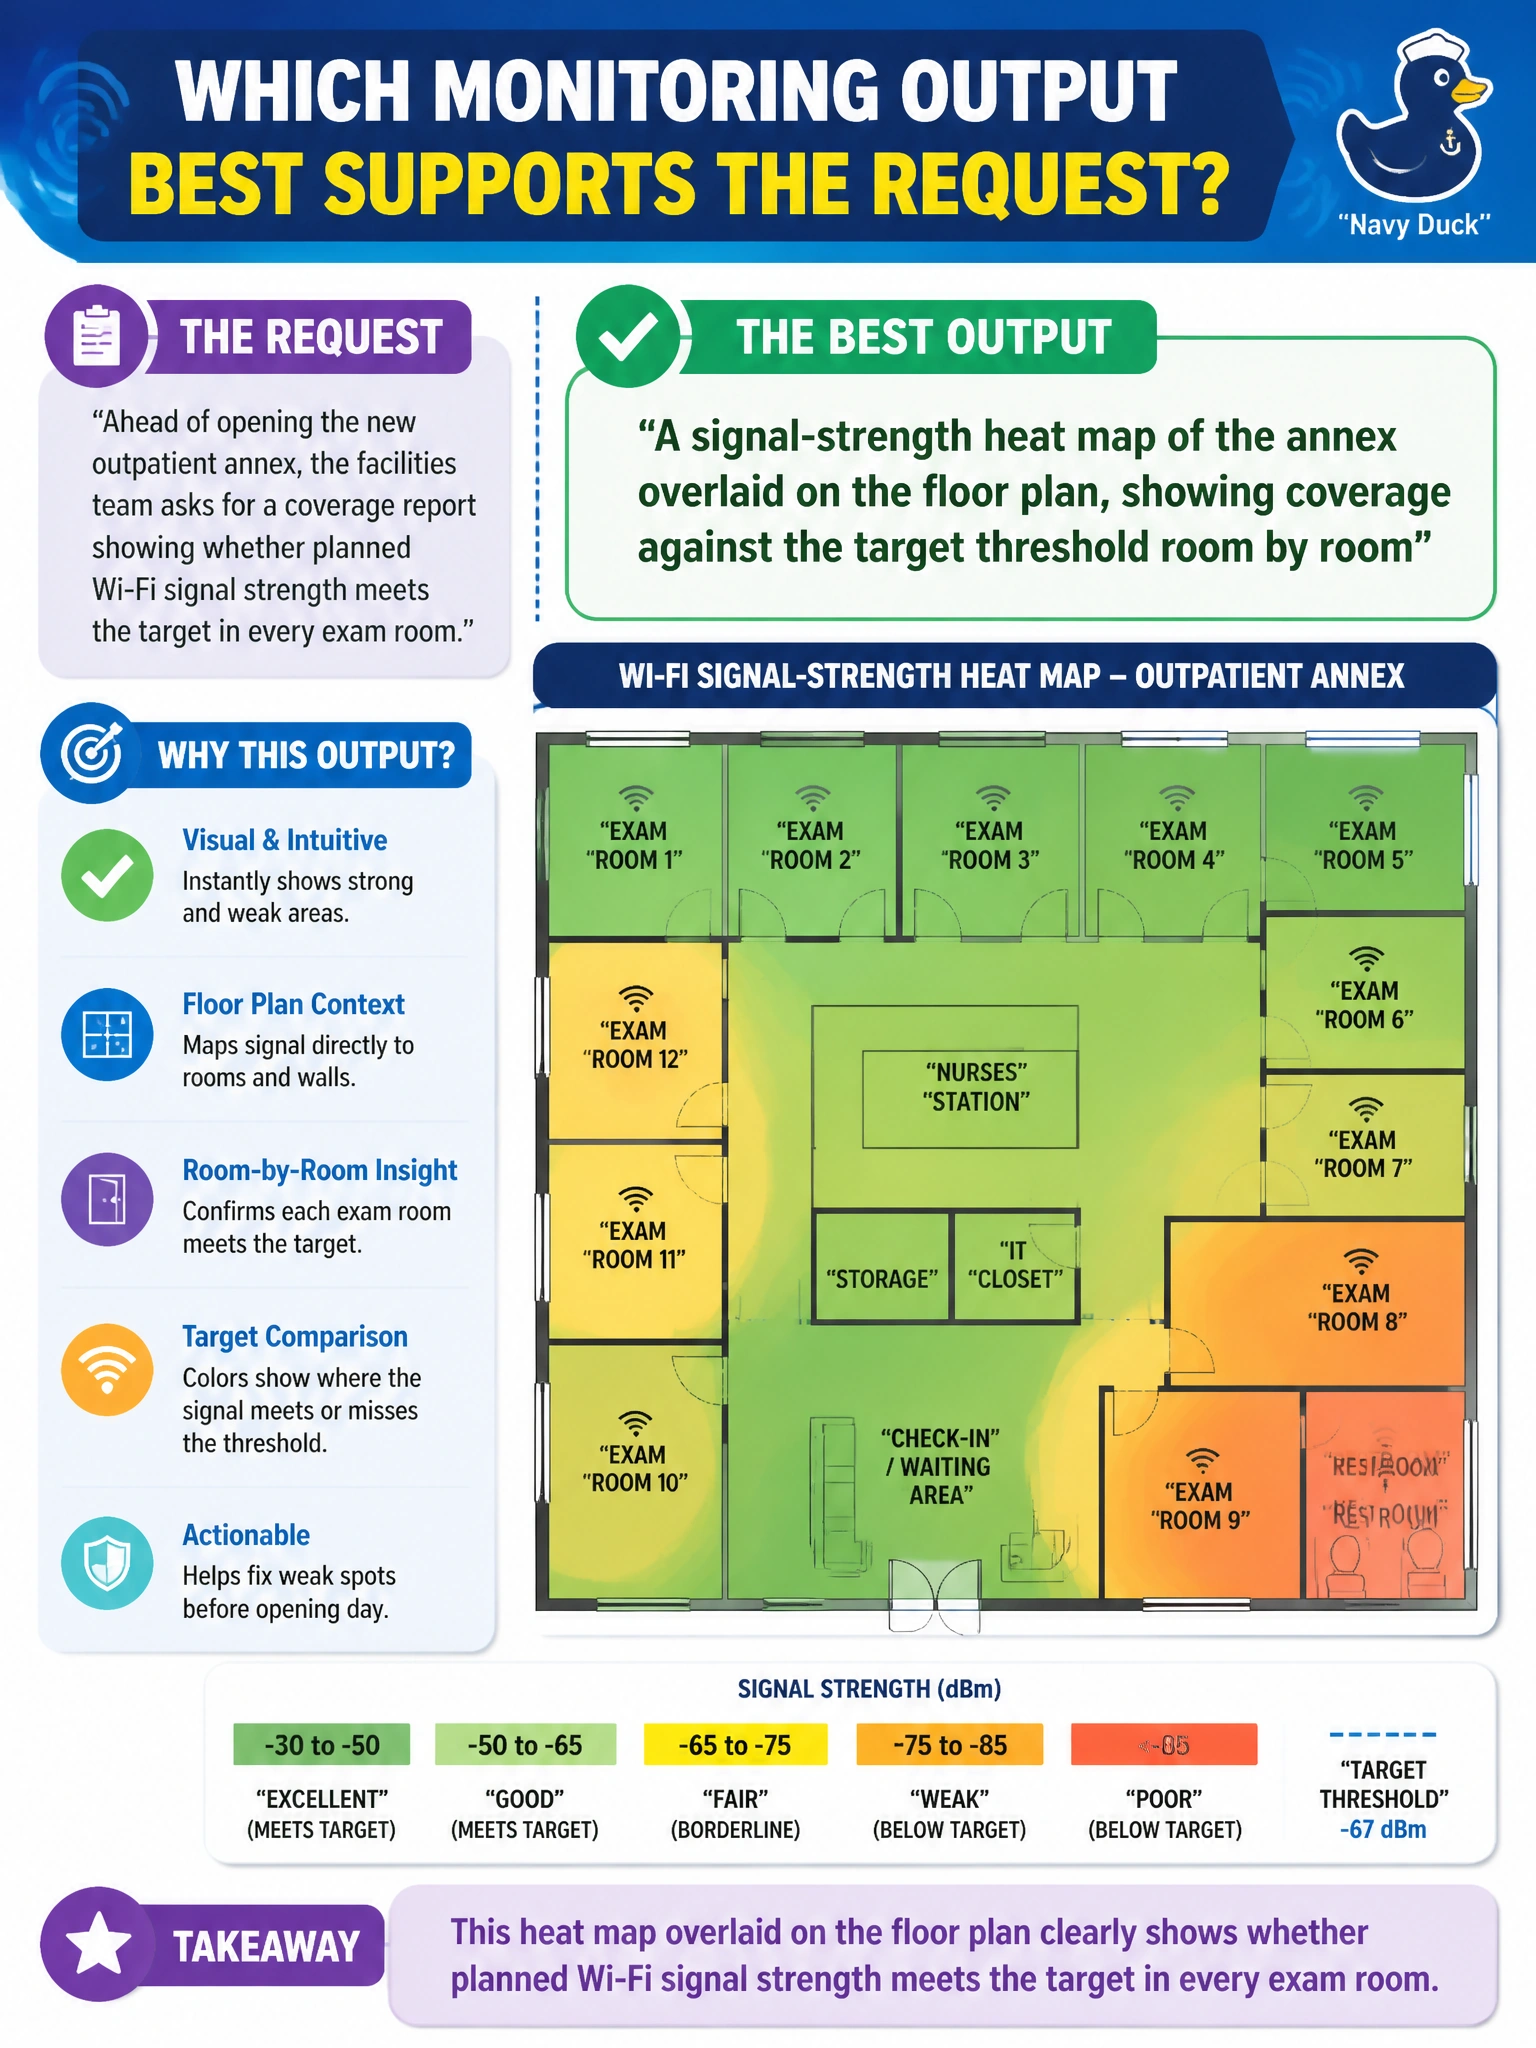
Ahead of opening the new outpatient annex, the facilities team asks for a coverage report showing whether planned Wi-Fi signal strength meets the target in every exam room. Which monitoring output best supports that specific request?
Select an answer to reveal the explanation.
Short Explanation
The question is literally "how strong is the signal, and where?" — so the answer is a picture of exactly that. A heat map laid over the floor plan shows coverage room by room against the target, the same way a thermal camera shows you cold spots in a building.
Full Explanation
A coverage report needs to answer a spatial question — is signal strength meeting a target throughout a physical space — and the tool built for that is a heat map that overlays measured or predicted RF strength onto the actual floor plan, letting the facilities team see room by room whether each exam room clears the threshold before the annex opens. A syslog export of configuration changes answers a change-history question, not a coverage question, and tells nothing about signal strength in any room. SNMP interface error counters describe wired-link health on switch ports, which is a useful but entirely different metric from wireless signal coverage in open floor space. A report on client operating systems describes what kind of devices are connecting, which speaks to client population, not to whether the RF design meets a coverage target. The distinction to keep straight for reporting purposes is that coverage is fundamentally a location-based measurement, so any output that does not tie a value to a place on the floor plan cannot answer this request. A reasonable operational check before finalizing the report is to walk any room that reads borderline on the heat map with a handheld survey tool and confirm the reading before the annex opens.