
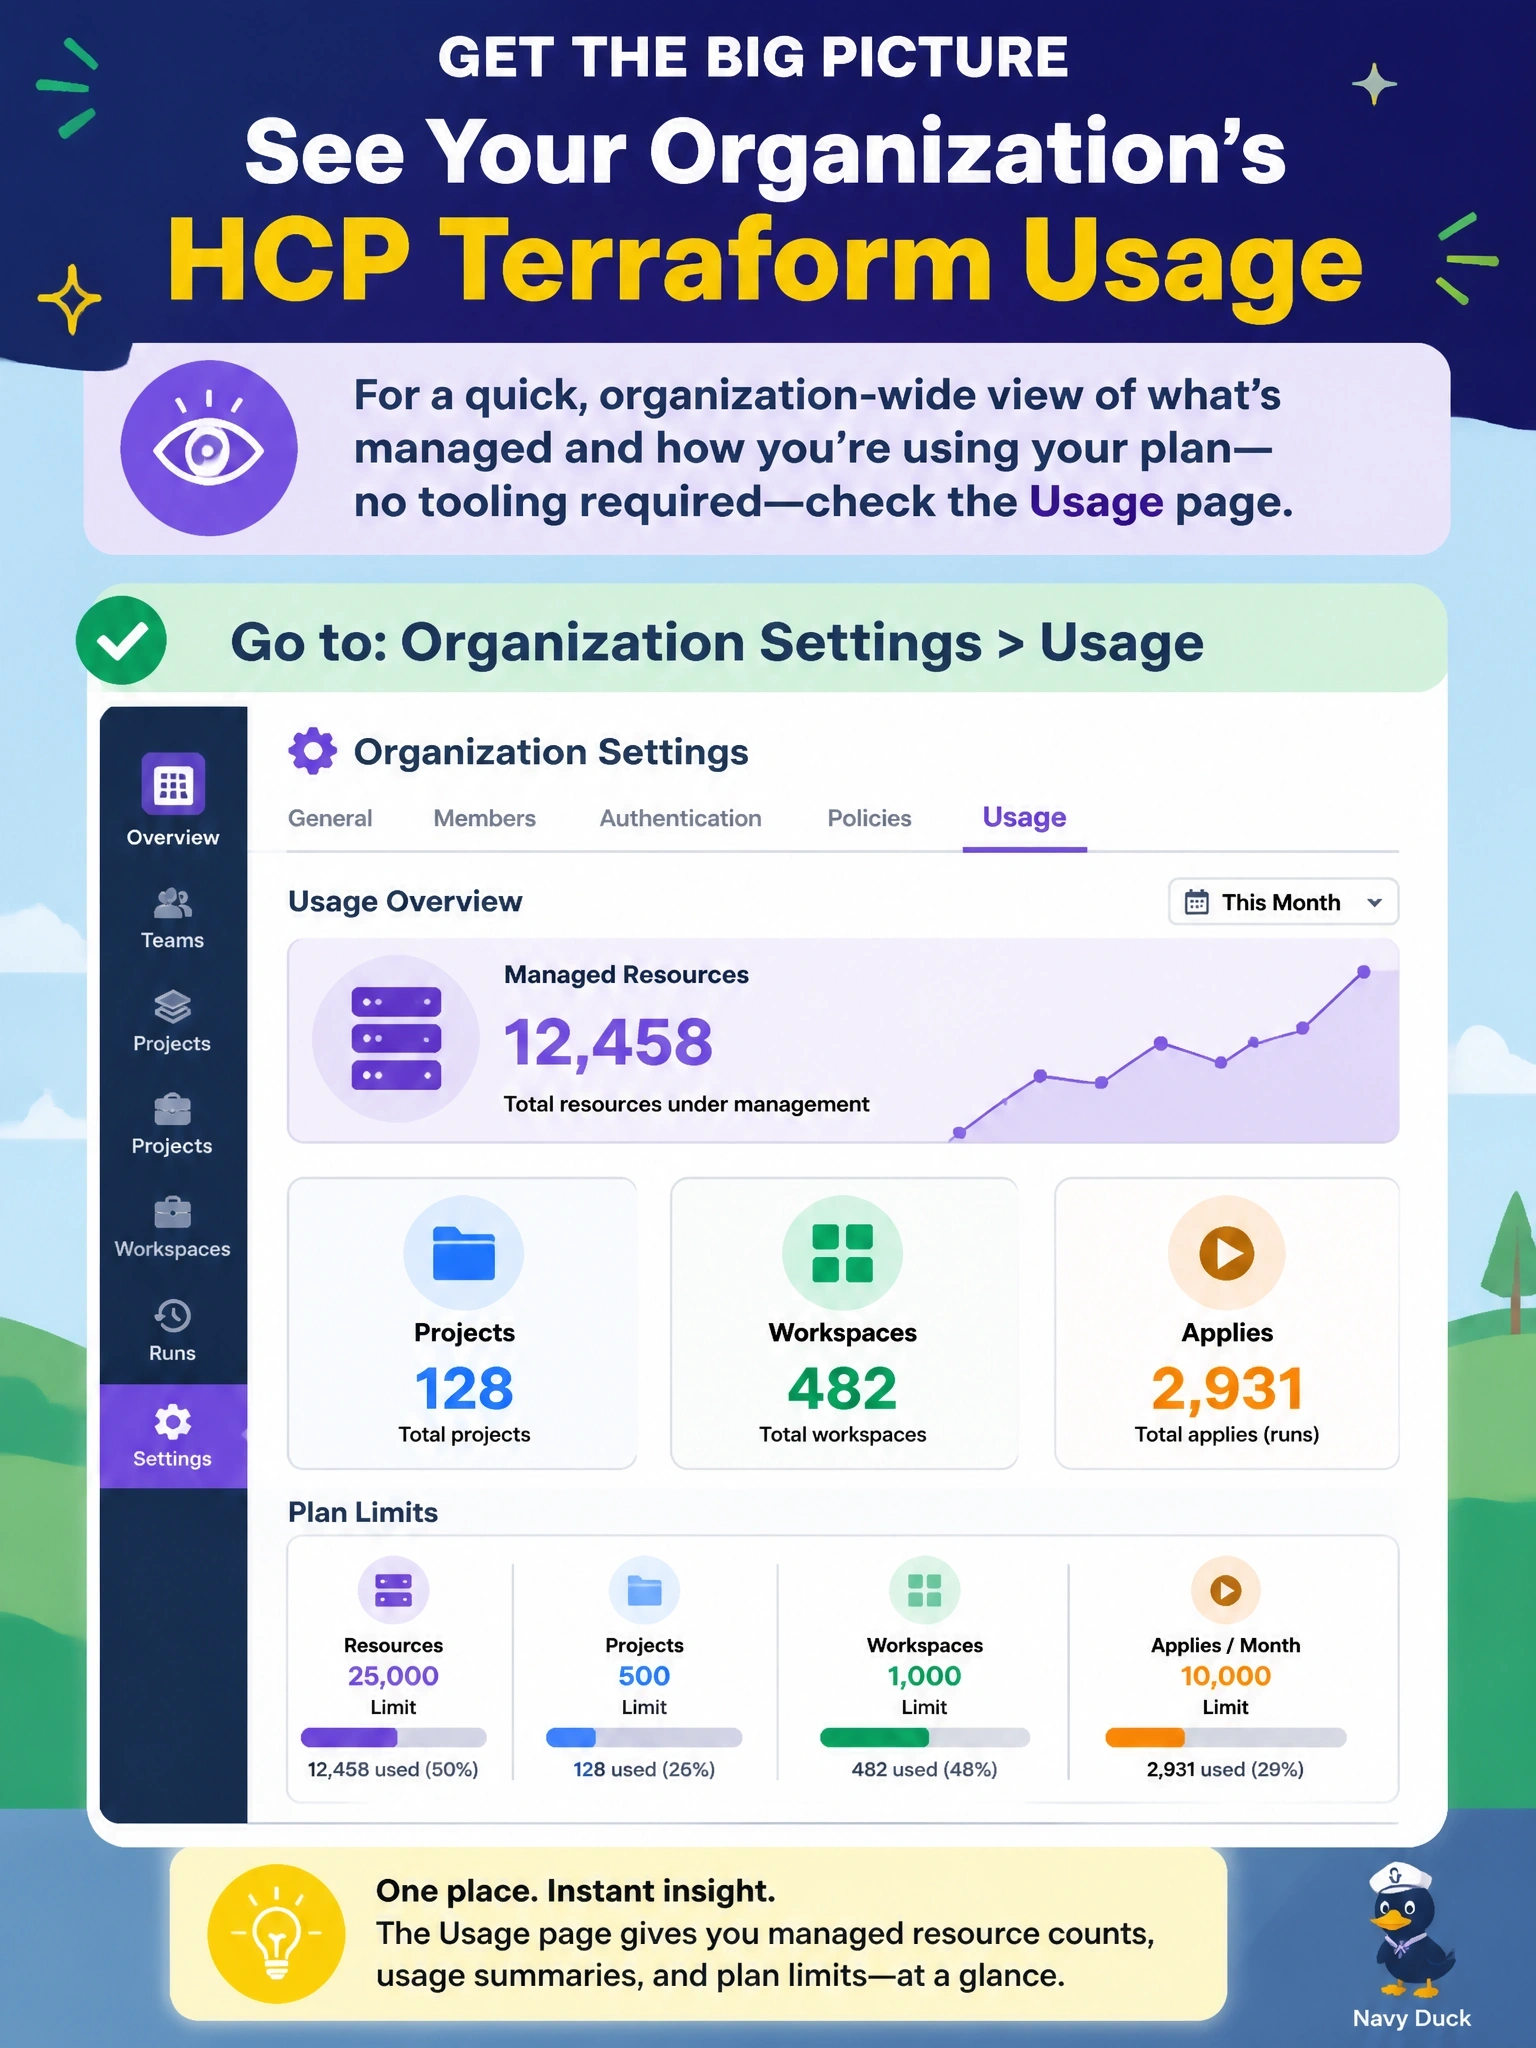
A director wants a quick organization-wide view of how many resources HCP Terraform currently manages, together with counts of projects, workspaces and applies and the plan's limits, without building any tooling. Where should the director look?
Select an answer to reveal the explanation.
Short Explanation
The Usage page is the dashboard on the car: one glance shows how many resources you're managing and how close you are to your plan's limits. Explorer and metrics can get there too, but only with extra assembly.
Full Explanation
Every HCP Terraform organization has a Usage report, opened by choosing Usage from the organization sidebar. It shows the total number of managed resources, which is the basis for billing, along with a summary of projects, workspaces, Stacks and applies, and the general limits for managed resources, concurrency and agents, plus compliance feature limits for run tasks and policies. That matches a no-tooling, at-a-glance request. The explorer can list workspaces and their resource counts, but it is a query tool, and the director would still have to total results and would get none of the plan limits. A cost estimation phase belongs to a single run and estimates cloud costs for that run's resources; it says nothing about the organization's managed resource total. The metrics endpoint does publish gauges such as per-workspace resource counts in Prometheus format, but it requires a metrics service token created by an owner and collection software to scrape it, which is the tooling the stem rules out, and it is offered on the Standard and Premium editions. Exam caveat: HCP Europe organizations keep their usage and billing separate from other regions. Operational check: open the Usage page, note the managed resource count, and compare it with the current billing period in the HCP portal.