
A developer is debugging an agent that occasionally generates incorrect test fixtures. The agent runs inside a CI pipeline and the developer cannot interactively prompt it. Which configuration produces the MOST useful inspectable artifacts for diagnosing the root cause?
Select an answer to reveal the explanation.
Short Explanation
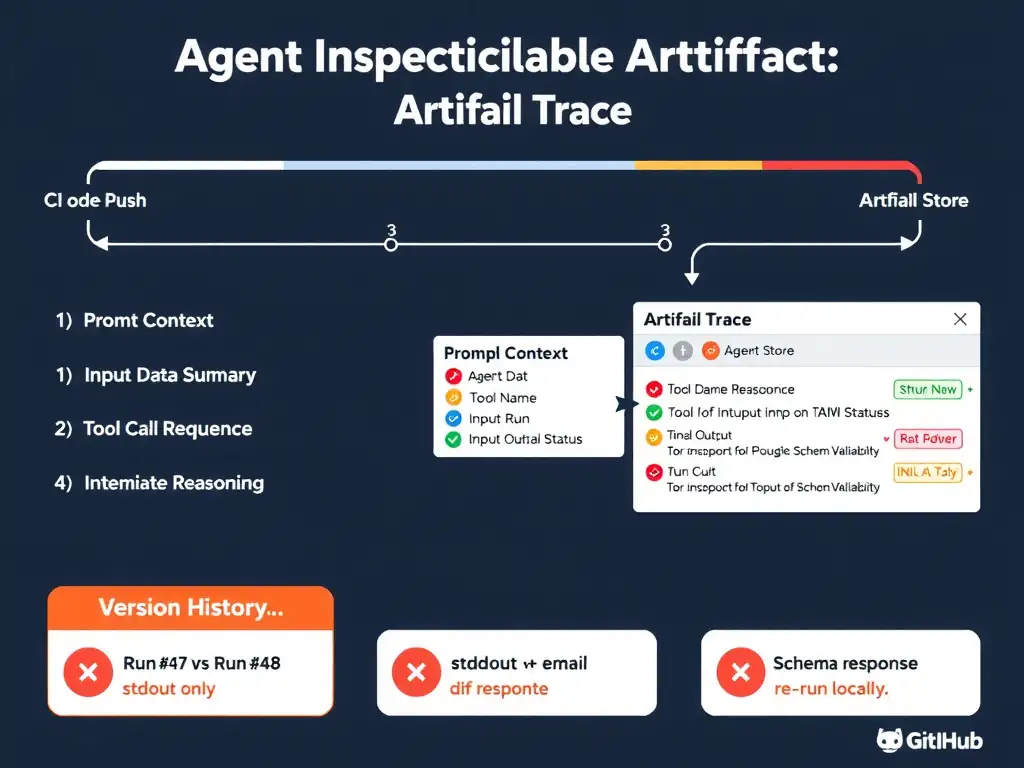
A black box that only shows its final answer is almost impossible to debug — you need the receipts. The structured trace artifact option gives you a flight data recorder for your agent: full prompt context, every tool call with inputs and outputs, intermediate reasoning steps, and schema validation results, all stored and versioned. When a test fixture comes out wrong, you can trace exactly where the reasoning diverged without re-running anything.
Full Explanation
Producing inspectable artifacts in standard development tooling means writing durable, structured, versioned outputs from every agent run that can be examined after the fact — particularly important in continuous-integration environments where there is no interactive debugging session. The structured trace artifact option is the right configuration. It provides the full diagnostic context needed to identify root causes: (1) the full prompt context shows whether the input was well-formed or contained unexpected data; (2) the tool call sequence with inputs and outputs reveals whether the agent called the right tools in the right order and whether tool responses were valid; (3) intermediate reasoning steps, such as chain-of-thought or planning steps, show where the agent's logic diverged from expected behavior; (4) the final output alongside a schema validation result immediately indicates whether the fixture was malformed structurally versus semantically incorrect. Storing this in a versioned artifact store, such as GitHub Actions artifacts or S3 with run metadata, means it can be compared across runs to identify regressions. The verbose stdout log stream option provides some visibility but has significant limitations: unstructured text is hard to query or diff across runs, stdout is ephemeral in many continuous-integration systems, and log verbosity without structure makes it hard to isolate specific tool calls or reasoning steps from surrounding noise. The email-last-response option captures only the final output, not the reasoning path. It provides no context about tool calls, intermediate steps, or prompt context — the three most likely locations of a bug. It also introduces out-of-band communication rather than keeping artifacts in the development pipeline. The local re-run option is a debugging approach, not an artifact configuration. It requires the developer to reproduce the failure, which may not be deterministic because agent behavior can vary by run, and it does not address the root cause of poor instrumentation. The correct fix is to instrument the agent properly so that continuous-integration runs are self-documenting. The exam objective is: 'Configure agent to produce inspectable artifacts within standard development tooling.' The canonical pattern is a structured trace artifact written to a versioned store on every run.