
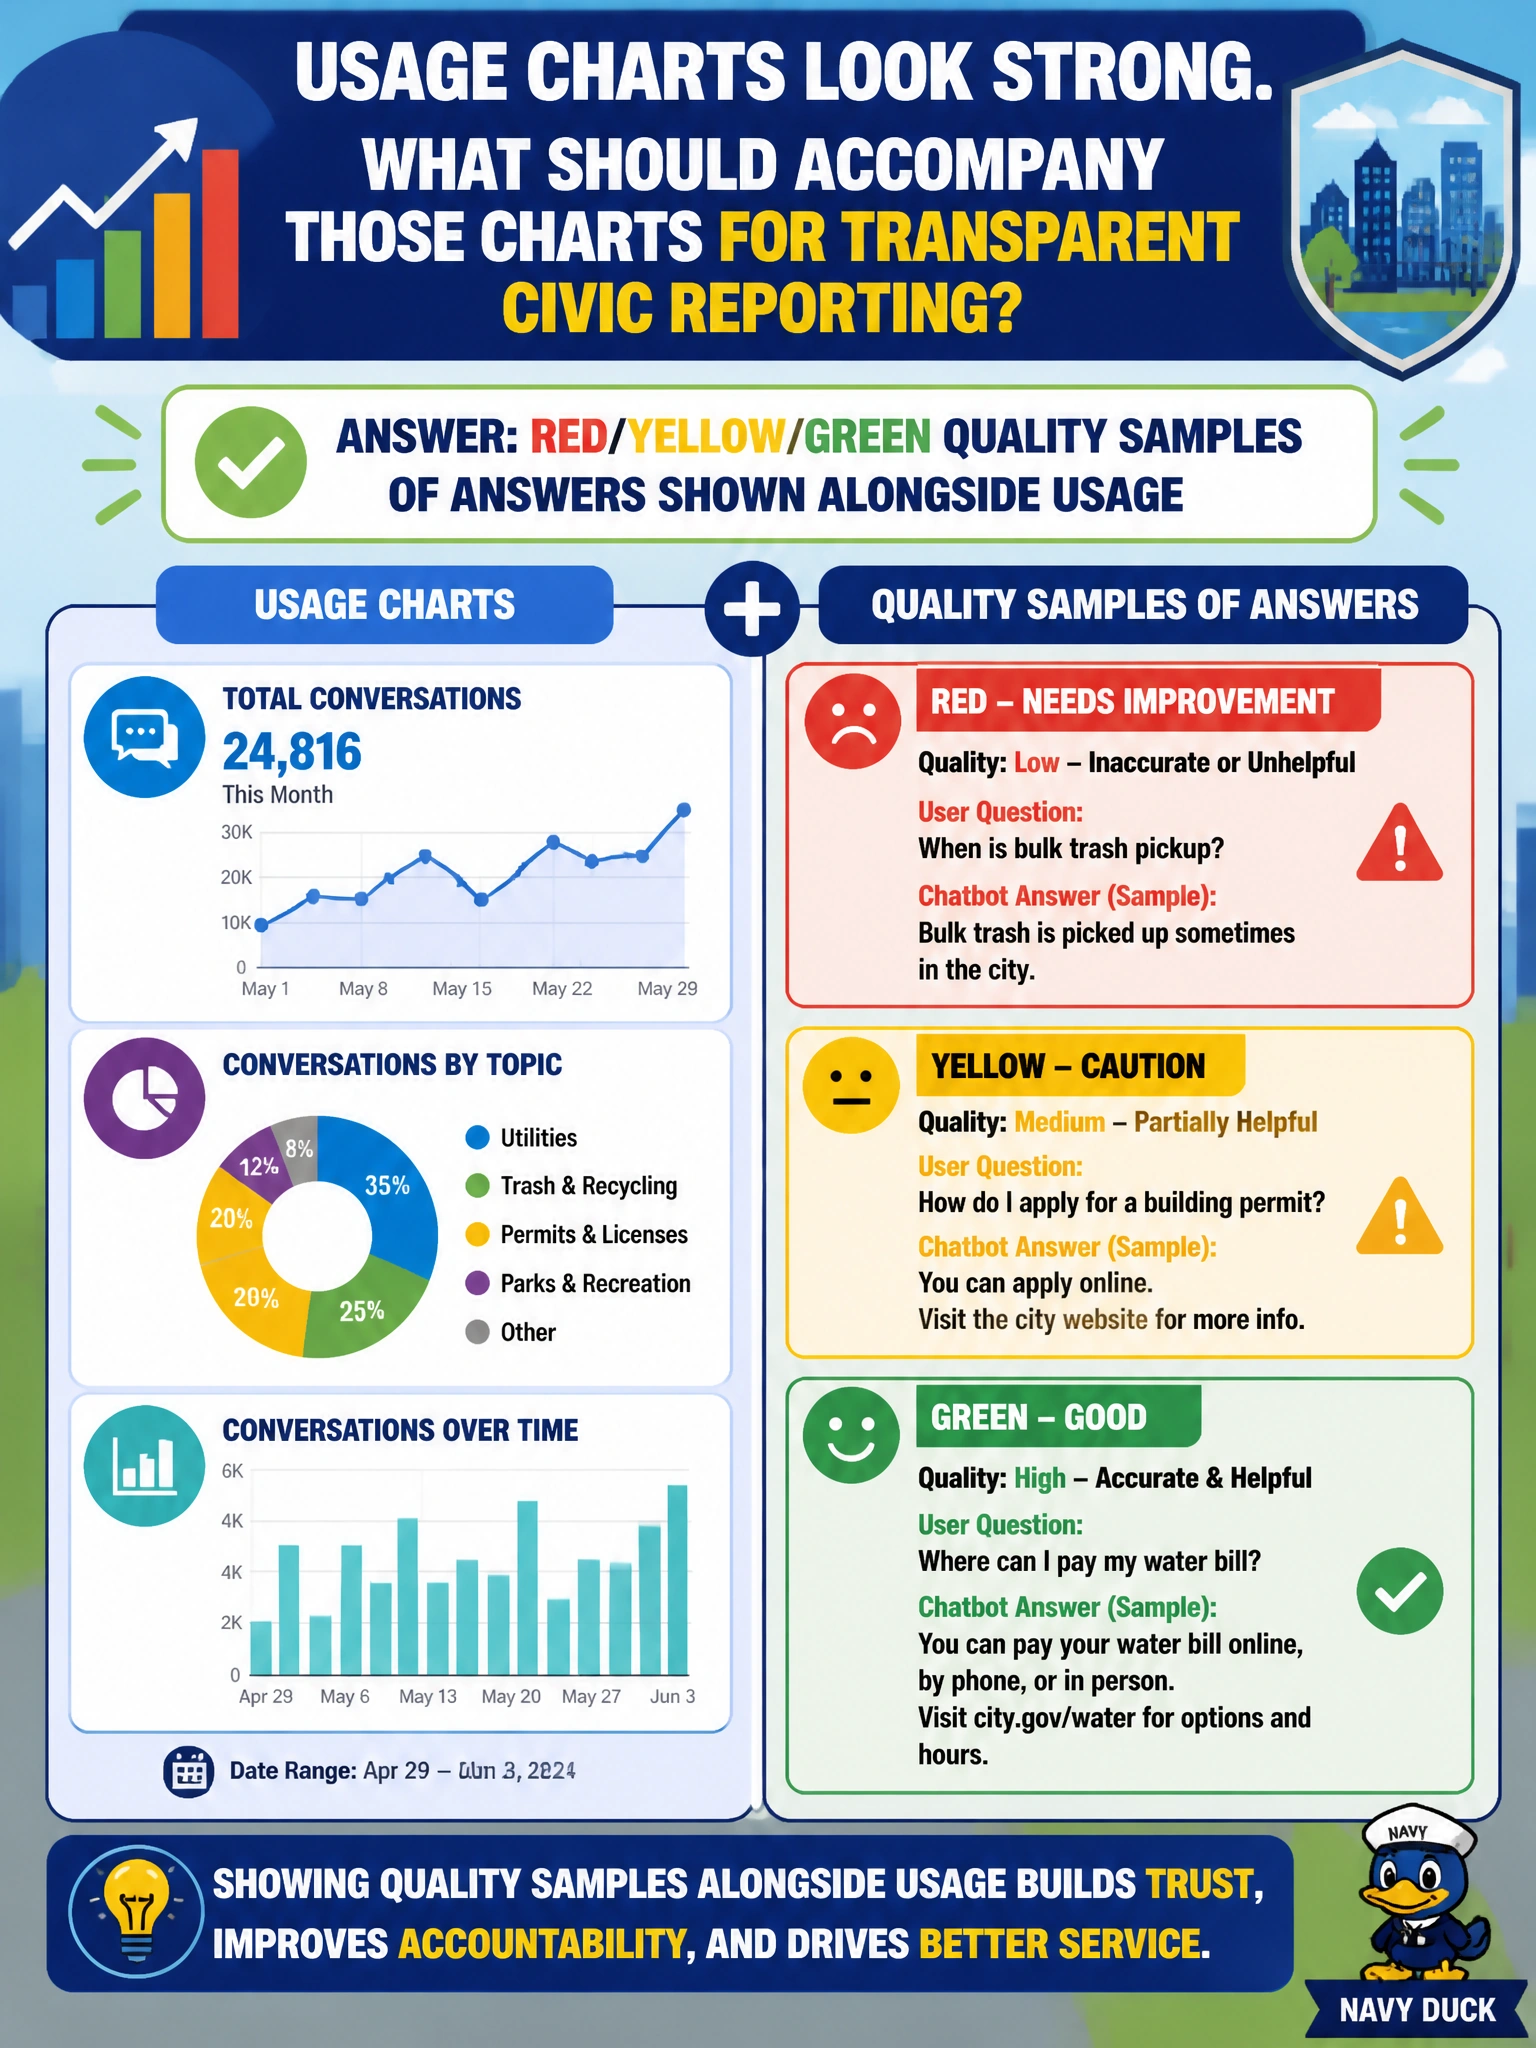
Usage charts for a city chatbot look strong. What should accompany those charts for transparent civic reporting?
Select an answer to reveal the explanation.
Short Explanation
Busy counters can still serve bad soup. Park red/yellow/green quality samples next to the usage chart so leadership sees how often answers are solid—not just how often people ask.
Full Explanation
When city chatbot usage charts look strong, transparent civic reporting should accompany them with red/yellow/green quality samples of answers. Volume shows demand and reach; graded samples show whether residents received accurate, policy-aligned guidance. Publishing both prevents leadership from mistaking traffic for trustworthiness in services that affect permits, benefits, or utilities. Claiming that volume alone proves trustworthiness fails conceptually because high traffic can coincide with systematic wrong answers, tone failures, or unsafe advice. Relying only on marketing quotes from the platform vendor fails because vendor testimonials are not local quality evidence and create appearance-of-oversight without auditability. Substituting raw training-loss curves for answer-quality sampling fails because training metrics describe model fit during build, not production civic answer fitness for residents. Exam caveat: exam stems often present impressive usage charts as a trap; correct answers insist on quality evidence beside adoption. Operational check: sample chatbot answers on a schedule, score them red/yellow/green against city policy, publish the grade mix beside usage in the civic brief, and open tickets for red patterns before the next council packet.