
Public-health historians note when machine learning entered outbreak surveillance versus older statistical dashboards. What milestone contrast are they drawing?
Select an answer to reveal the explanation.
Short Explanation
First came the chart walls that counted cases the old statistical way; then ML started spotting patterns humans used to sketch by hand. You’re watching historians mark that handoff in public-health analytics. Same mission, new milestone—not an either/or.
Full Explanation
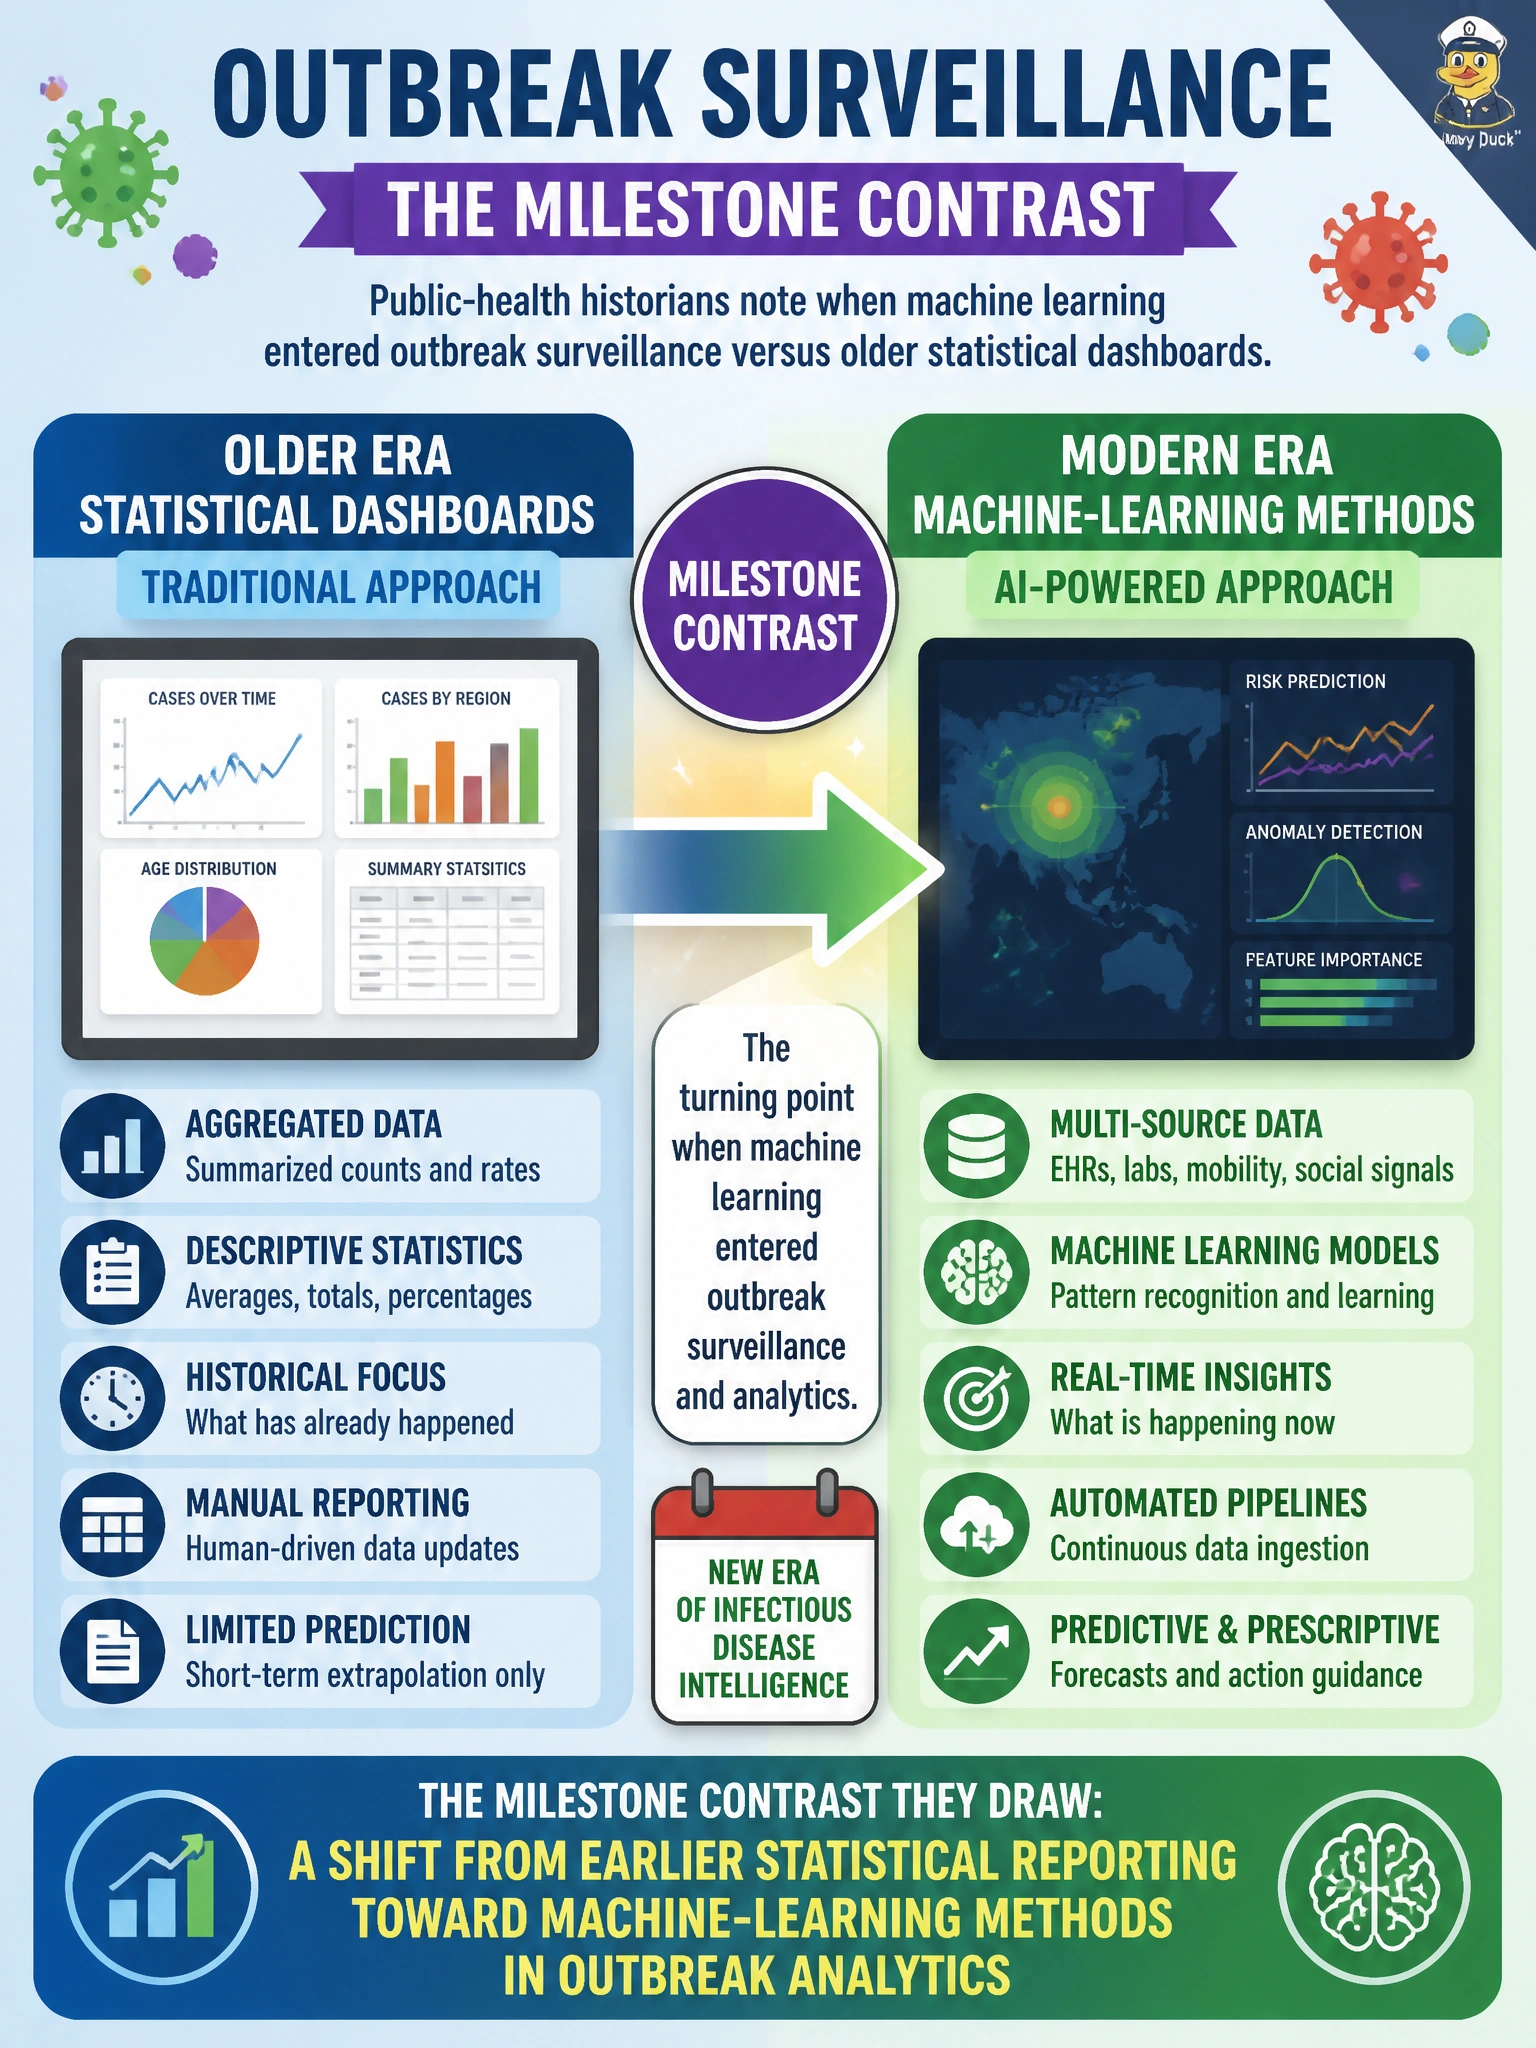
Public-health historians drawing this contrast are marking a shift from earlier statistical reporting toward machine-learning methods in outbreak analytics. Older dashboards and surveillance reports relied heavily on descriptive statistics, threshold alerts, and epidemiologist-defined indicators. Machine learning later entered with models that learn patterns from higher-dimensional signals—syndromic text, mobility proxies, lab metadata—to support detection and prioritization. The milestone is not that statistics disappeared, but that ML methods became part of the outbreak-analytics toolkit alongside classical reporting. Historians use that handoff to explain why modern surveillance programs need model validation skills in addition to traditional epi statistics.
Saying the contrast is a shift from earlier statistical sampling toward machine-learning prediction in outbreak analytics narrows both ends incorrectly, since the milestone was broader statistical reporting giving way to machine-learning methods, not just sampling to prediction. Claiming the milestone is a shift from earlier statistical estimation toward machine-learning detection in outbreak analytics misplaces the scope, since the contrast is statistical reporting broadly versus machine-learning methods for outbreak analytics, not estimation versus detection. Asserting the contrast is a shift from earlier statistical surveillance toward machine-learning forecasting in outbreak analytics narrows both ends incorrectly, since the milestone was broader statistical reporting giving way to machine-learning methods, not just surveillance to forecasting.
Exam caveat: the contrast is earlier statistical reporting → ML methods in outbreak analytics. Statistics remain relevant; the tested idea is the historical addition/shift toward ML, not mutual exclusion.
Operational check: inventory which surveillance products are descriptive dashboards versus ML-scored alerts, validate ML signals with epidemiologists before public action, maintain classical indicators as baselines during model incidents, and document when ML components were introduced so historical comparisons remain interpretable.
Prefer to study offline? Printable PDF study book + test engine ($7.50, unofficial). These questions stay free here.