What does the statistical measure of variance actually quantify about a dataset?
Select an answer to reveal the explanation.
Short Explanation and Infographic
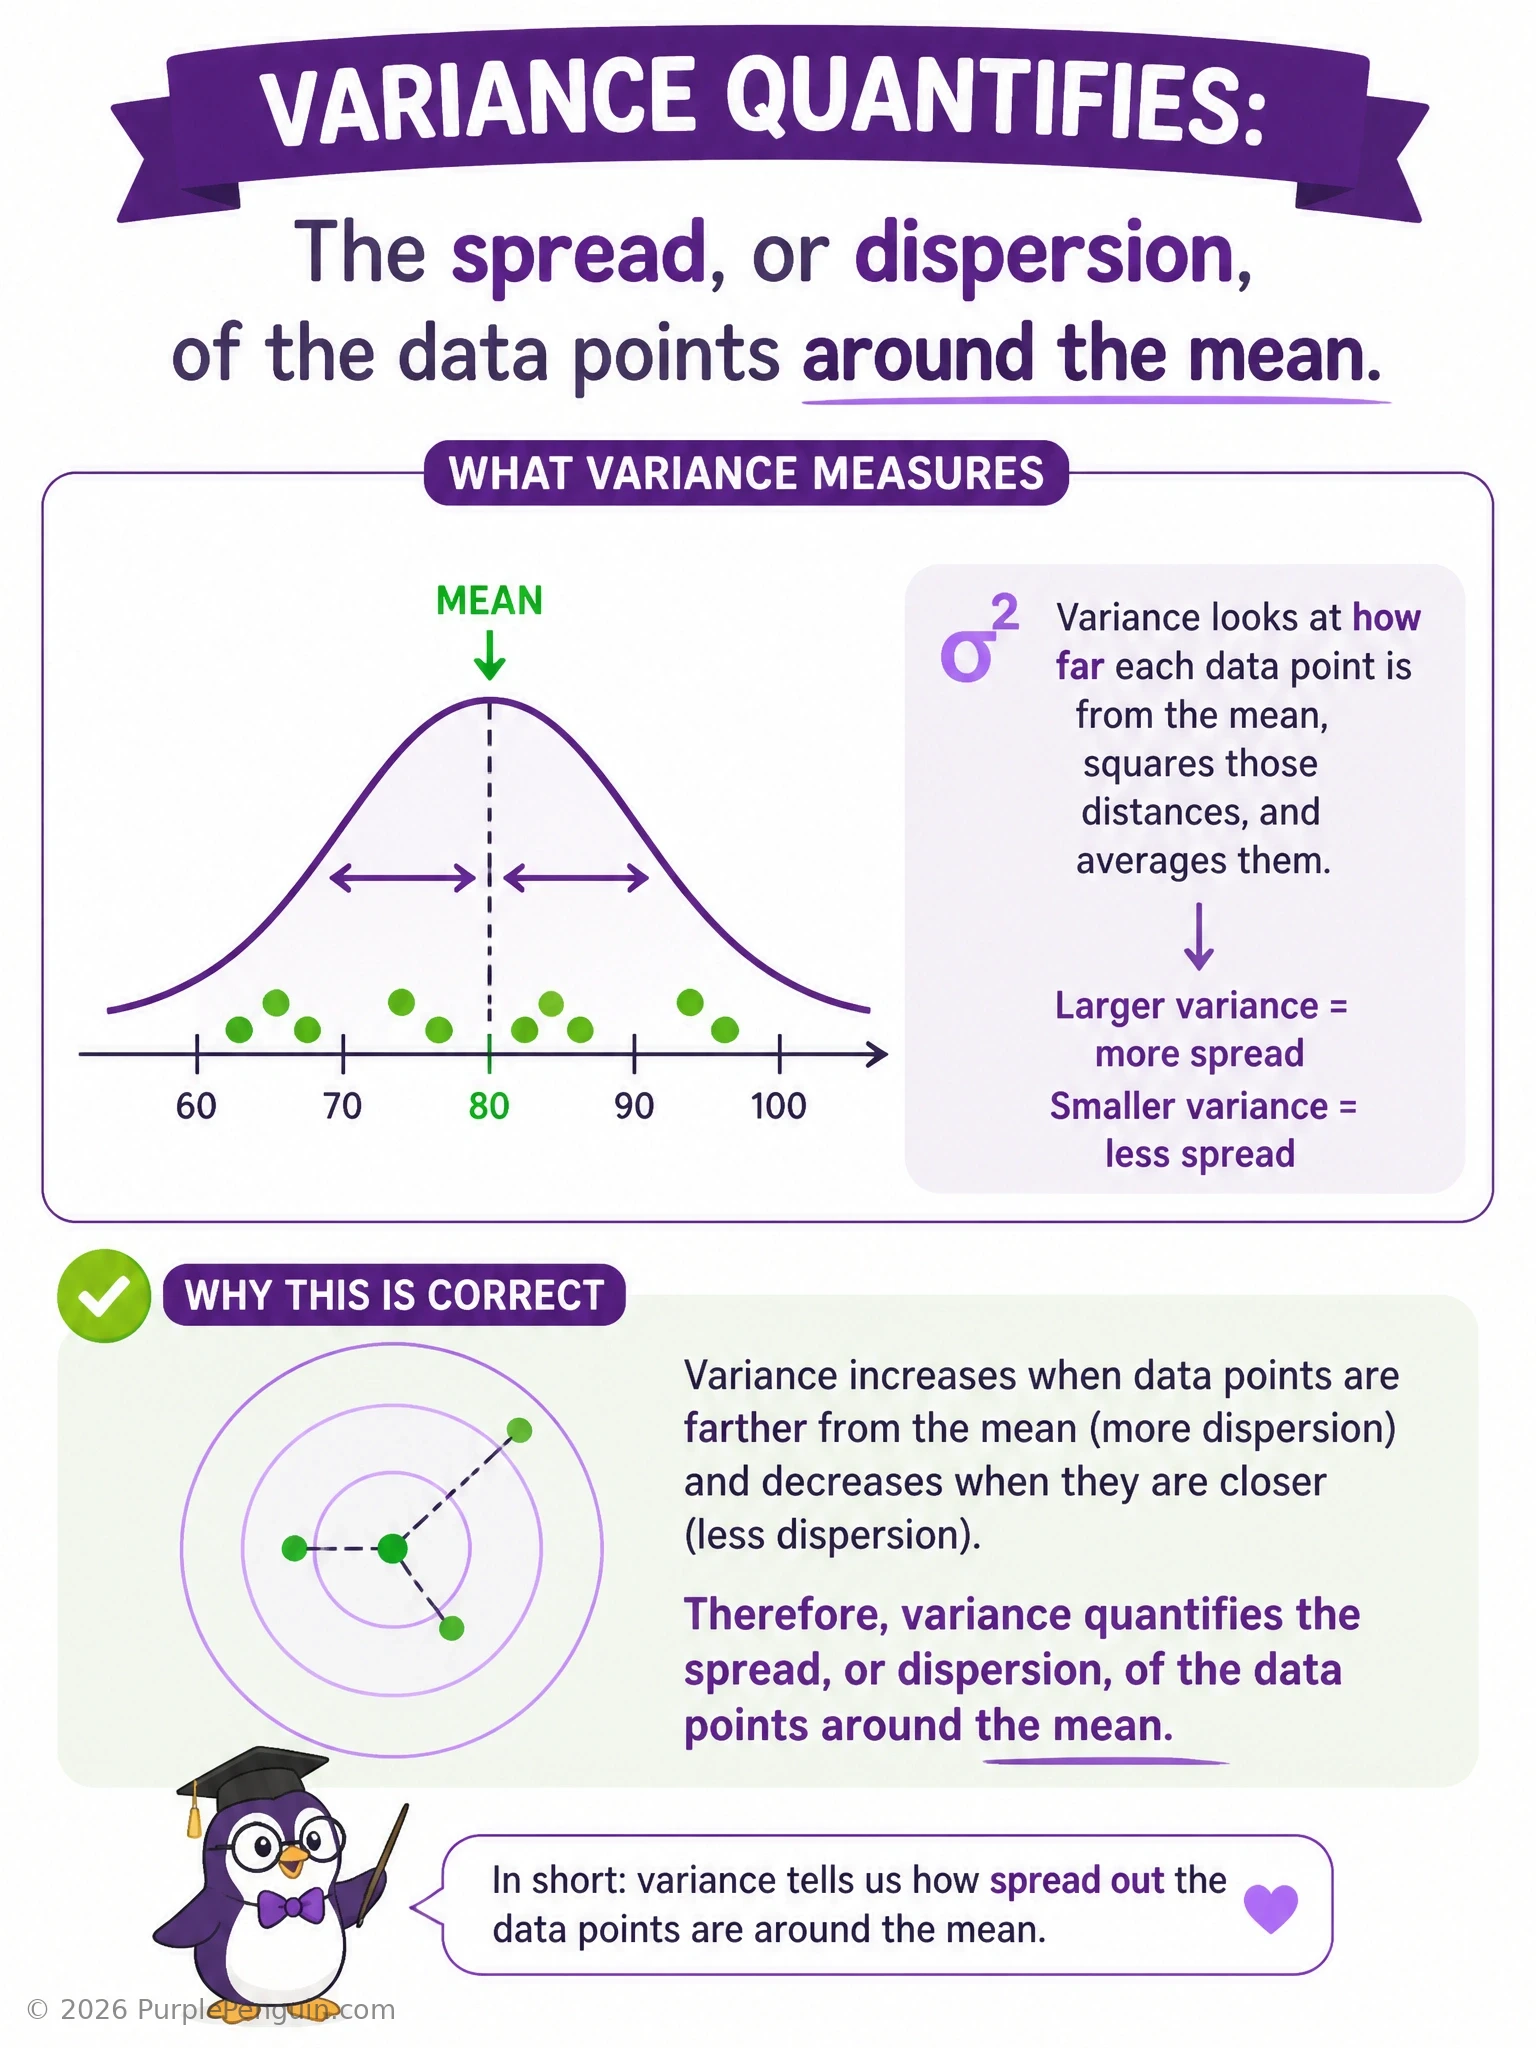
Variance is all about spread. Picture two classes that both average an 80 on a test: in one class everyone scored between 78 and 82, and in the other, scores ranged from 40 to 100. Same average, wildly different spread — and variance is the number that captures that difference. Formally, it's the average of the squared distances between each data point and the mean. The most-frequent-value option is describing the mode, not variance. The sorted middle value is the median — again, a totally different statistic. And max-minus-min is the range, which only looks at the two extreme points and ignores everything in between. Variance, unlike range, actually accounts for every single data point's distance from the center.
Full explanation below image
Full Explanation
Variance is a statistical measure that quantifies the dispersion, or spread, of a set of data points relative to their mean. Mathematically, population variance is calculated as the average of the squared differences between each data point and the mean: σ² = (1/N) Σ(xᵢ − μ)². Squaring the differences ensures that deviations above and below the mean don't cancel each other out and gives proportionally greater weight to points further from the mean. A low variance indicates data points cluster tightly around the mean, while a high variance indicates the data points are widely scattered. Its square root, the standard deviation, expresses this spread in the same units as the original data, which is often more interpretable.
The 'most frequently occurring value' distractor describes the mode, a completely different measure of central tendency that identifies the most common value, not the dataset's dispersion.
The 'middle value when sorted' distractor describes the median, another measure of central tendency (a robust alternative to the mean) that identifies the midpoint of an ordered dataset — it says nothing about how spread out the values are around that midpoint.
The 'largest minus smallest value' distractor describes the range, a much cruder spread measure that depends entirely on the two extreme values and ignores the distribution of everything in between; a single outlier can distort the range dramatically, whereas variance incorporates every data point's deviation from the mean, making it more representative of overall spread (though also sensitive to outliers due to squaring).
In deep learning and ML practice, understanding variance underlies concepts like the bias-variance tradeoff, feature scaling/normalization (which often uses variance or standard deviation), and the variance term in batch normalization. A useful memory aid: 'variance = how far, on average, everyone strays from home (the mean), squared so the strays count double.'