
City SRE wants time-series metrics dashboards and alert visualizations for municipal cloud workloads. Which tool purpose should they choose?
Select an answer to reveal the explanation.
Short Explanation
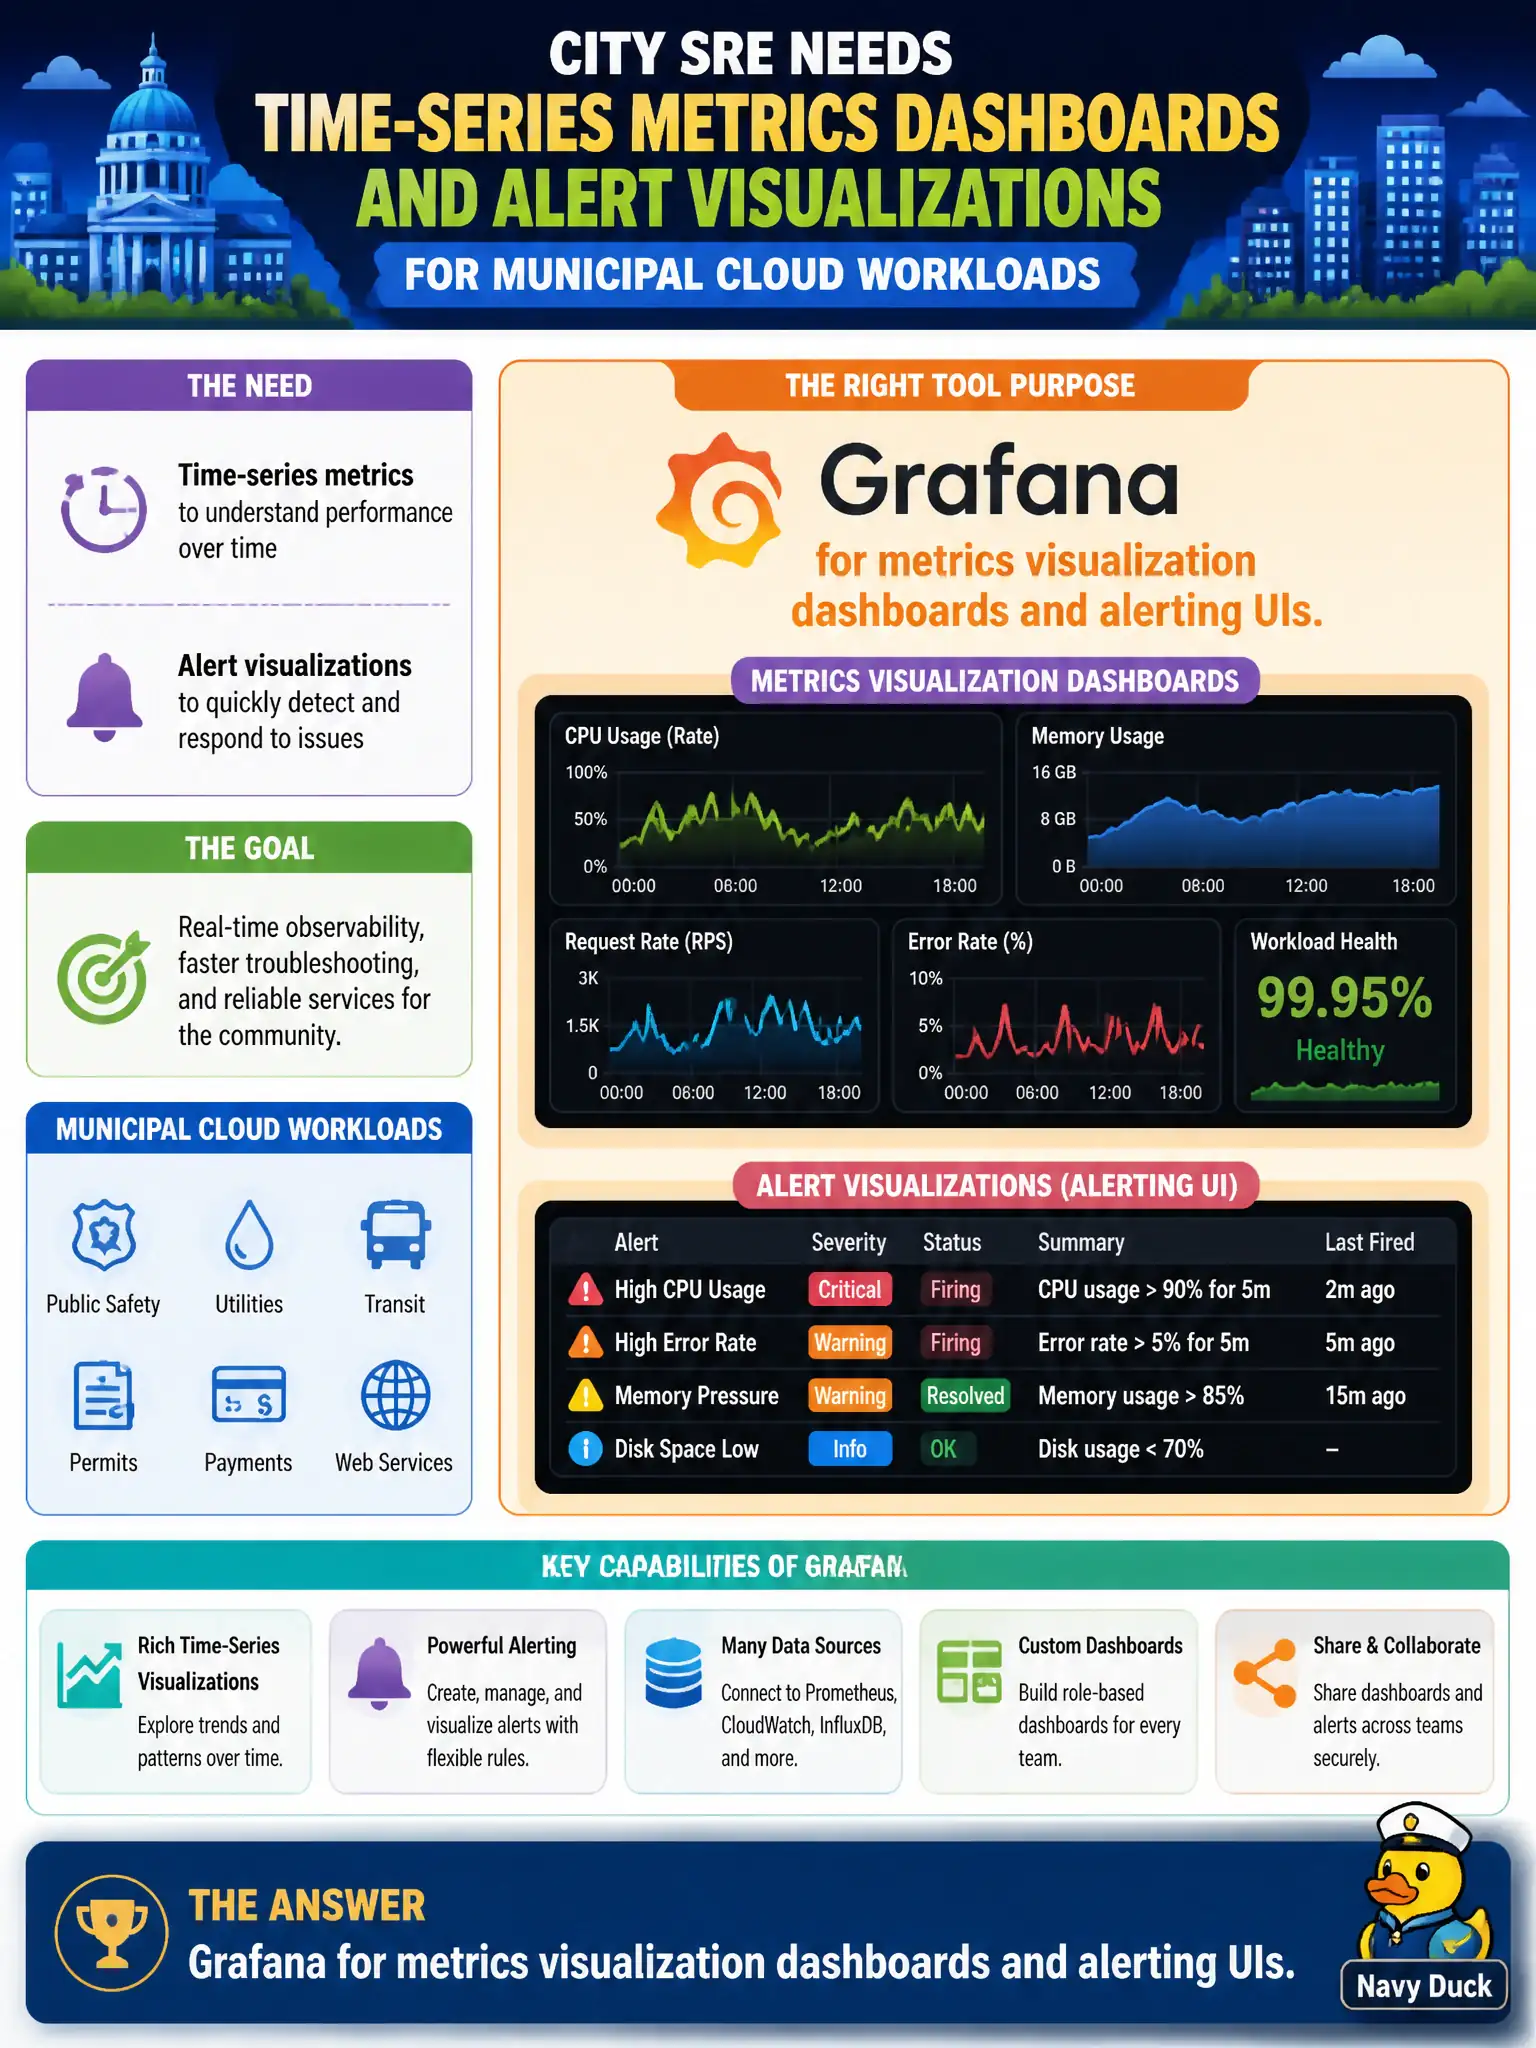
SRE eyes want charts and alerts over time-series metrics—Grafana’s sweet spot. Registries and document templates are useful elsewhere, but they do not draw those ops dashboards. Hook metrics in, build panels, and page when thresholds trip.
Full Explanation
City SRE that wants time-series metrics dashboards and alert visualizations for municipal cloud workloads should choose Grafana for metrics visualization dashboards and alerting UIs. Grafana commonly fronts Prometheus or cloud metric sources for civic observability. A word processor template library for council meeting minutes is document management, not metrics UX. A source-control host used only to store README files does not visualize time-series. A container image registry that only stores OCI artifacts holds images, not live metric dashboards. Exam caveat: Grafana visualizes and alerts; metric collection agents and TSDB backends are complementary components in the municipal observability stack. Operational check: connect Grafana to the metrics source, build a dashboard for a pilot civic service, define an alert rule with a notification channel, test firing and resolution, and export dashboard JSON into Git for change control. In municipal cloud operations, record the chosen control and the rejected alternatives in the change or incident ticket so future on-call staff understand which failure modes were avoided for city services. Re-validate after the next maintenance window that the same decision still holds under current provider limits, identity bindings, and application versions used by the civic platform team.