
A BIA "report" is a single slide of clip art with no estimates of how impact grows over time if functions stay down. Why is that inadequate?
Select an answer to reveal the explanation.
Short Explanation
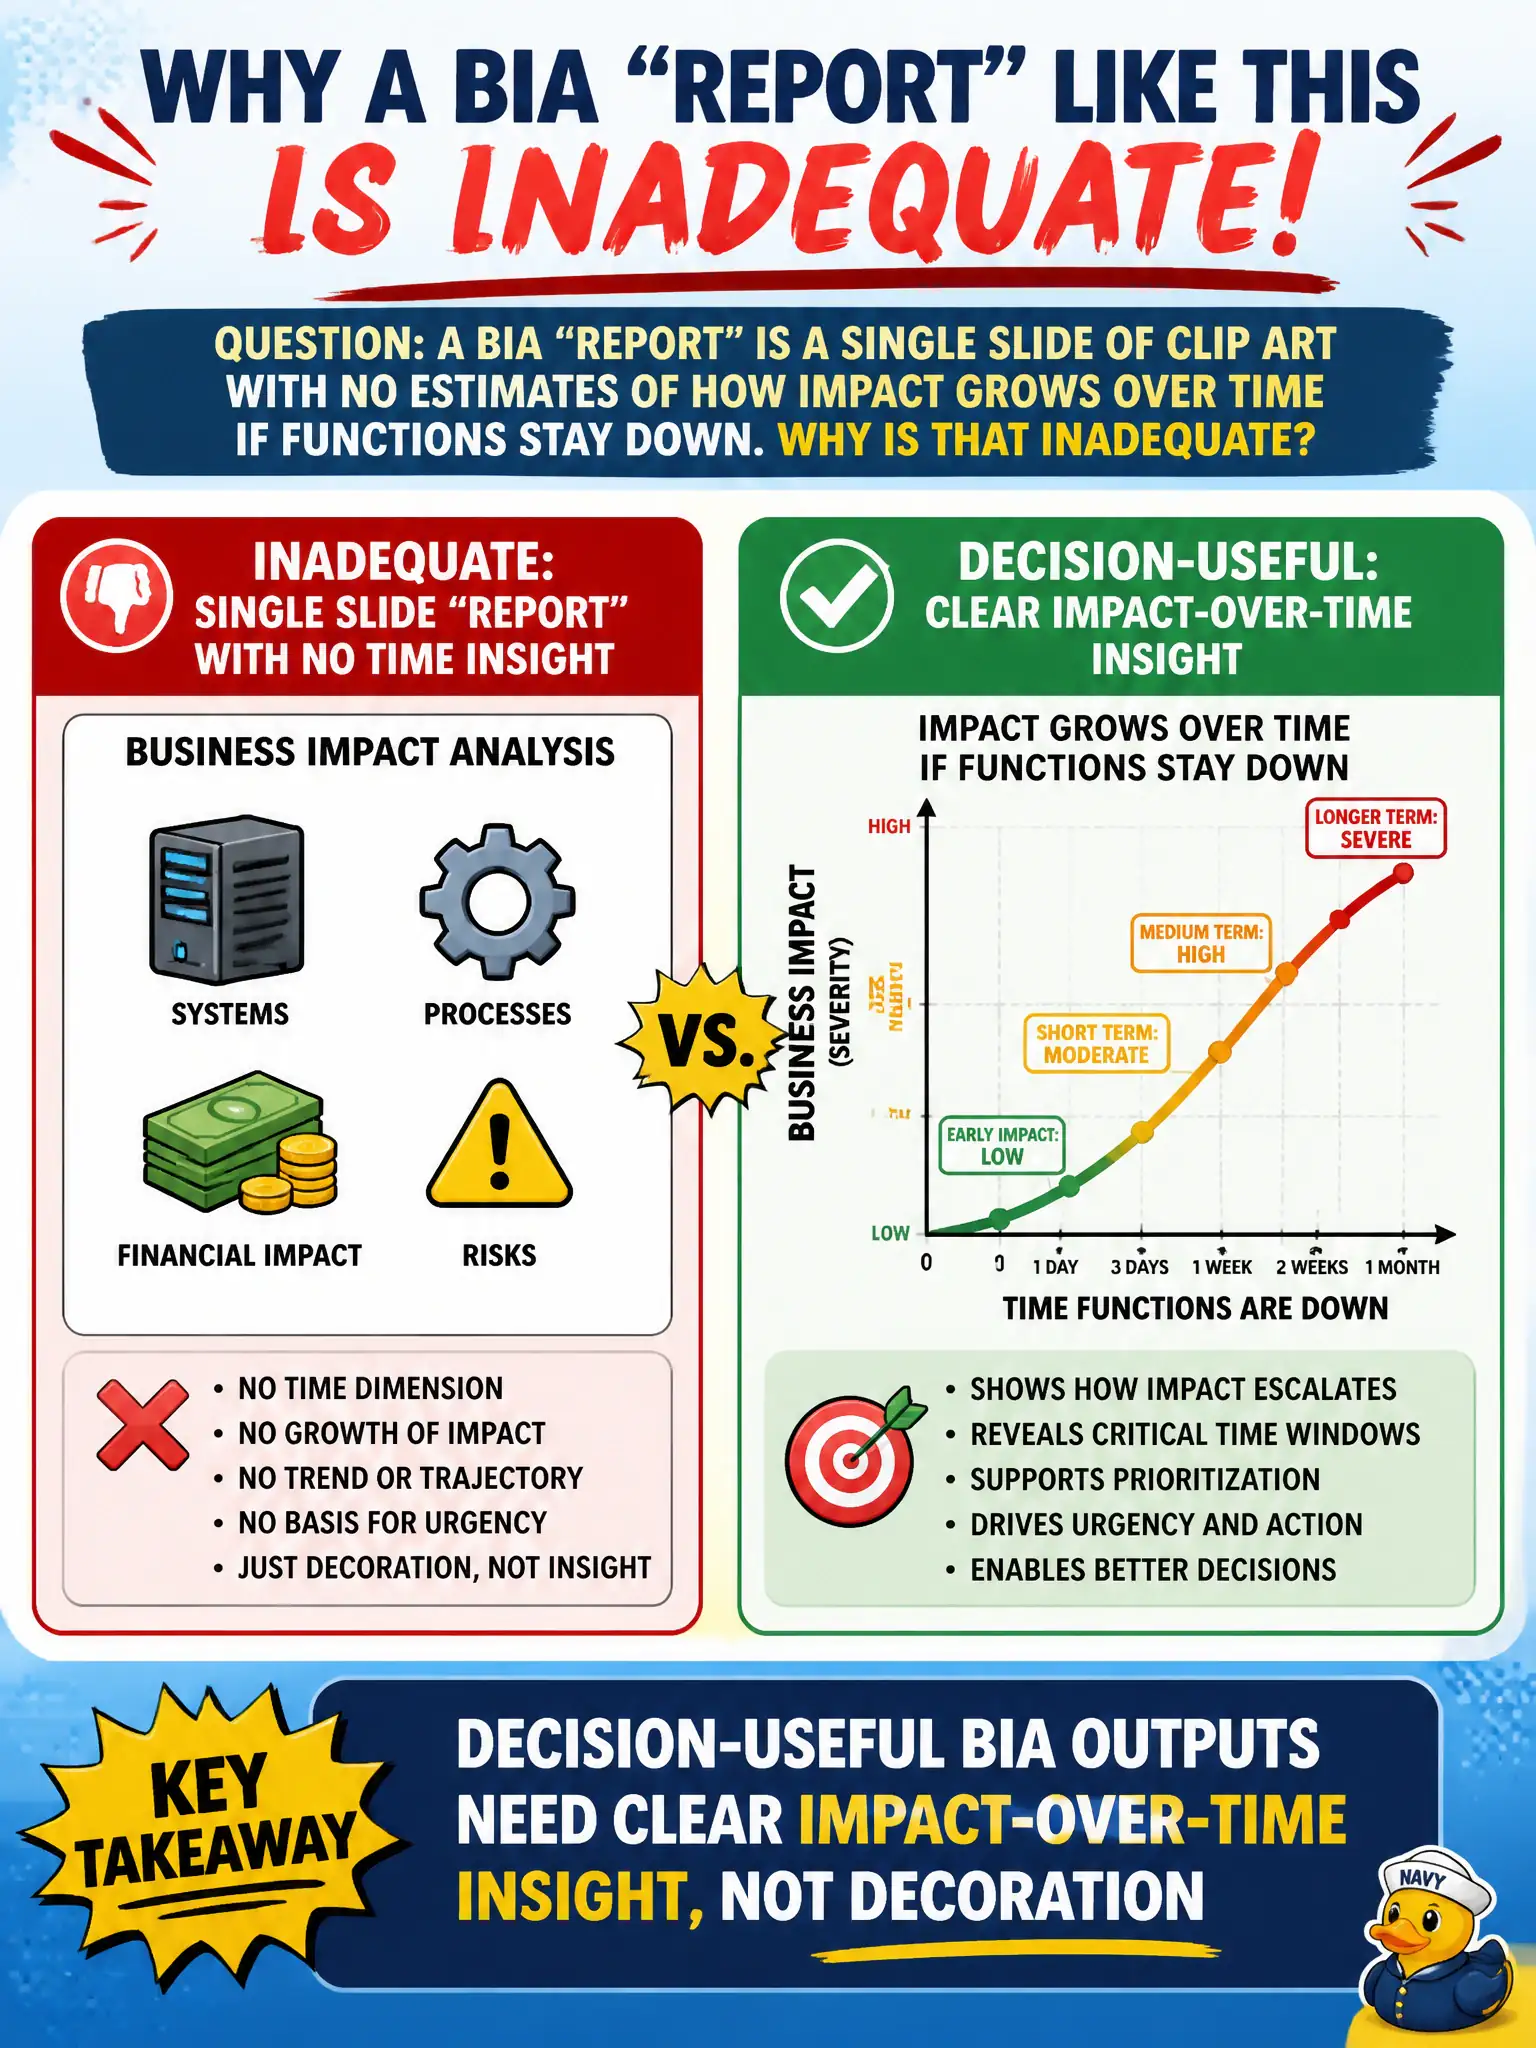
Pretty pictures don't tell the mayor when the permit desk collapse becomes a crisis. Decision-makers need "if this stays down, here's how bad it gets and how fast" — that's the point of a BIA report.
Full Explanation
Decision-useful BIA outputs need clear impact-over-time insight, not decoration is why a single clip-art slide with no estimates of how impact grows if functions stay down is inadequate. Leaders need to see how harm escalates across hours and days to set recovery time objectives and justify resources. Civic continuity decisions—whether for permitting, utilities, or public-safety support—depend on that time-phased impact narrative rather than visual filler.
Preferring clip art because executives cannot interpret time-to-impact data fails by concept because executives can and must use impact timelines; dumbing outputs into decoration removes decision value and invites arbitrary recovery guesses. Claiming BIA reports must omit downtime effects to remain vendor-neutral fails because downtime effects are the analytical core of a business impact analysis and have nothing to do with vendor neutrality. Claiming impact-over-time estimates are only for marketing fails because marketing collateral is not continuity planning; BIA exists to drive operational recovery priorities.
Exam caveat: MSI CRMC BIA quality includes impact-over-time (or equivalent) insight for prioritization. Decorative slides without analytical content fail the purpose of the assessment.
Operational check: Rebuild the municipal BIA summary with time-phased impact for top functions (for example at 4, 24, and 72 hours), link each curve to a proposed RTO, and present that analysis—not clip art—to the continuity steering group for approval.