
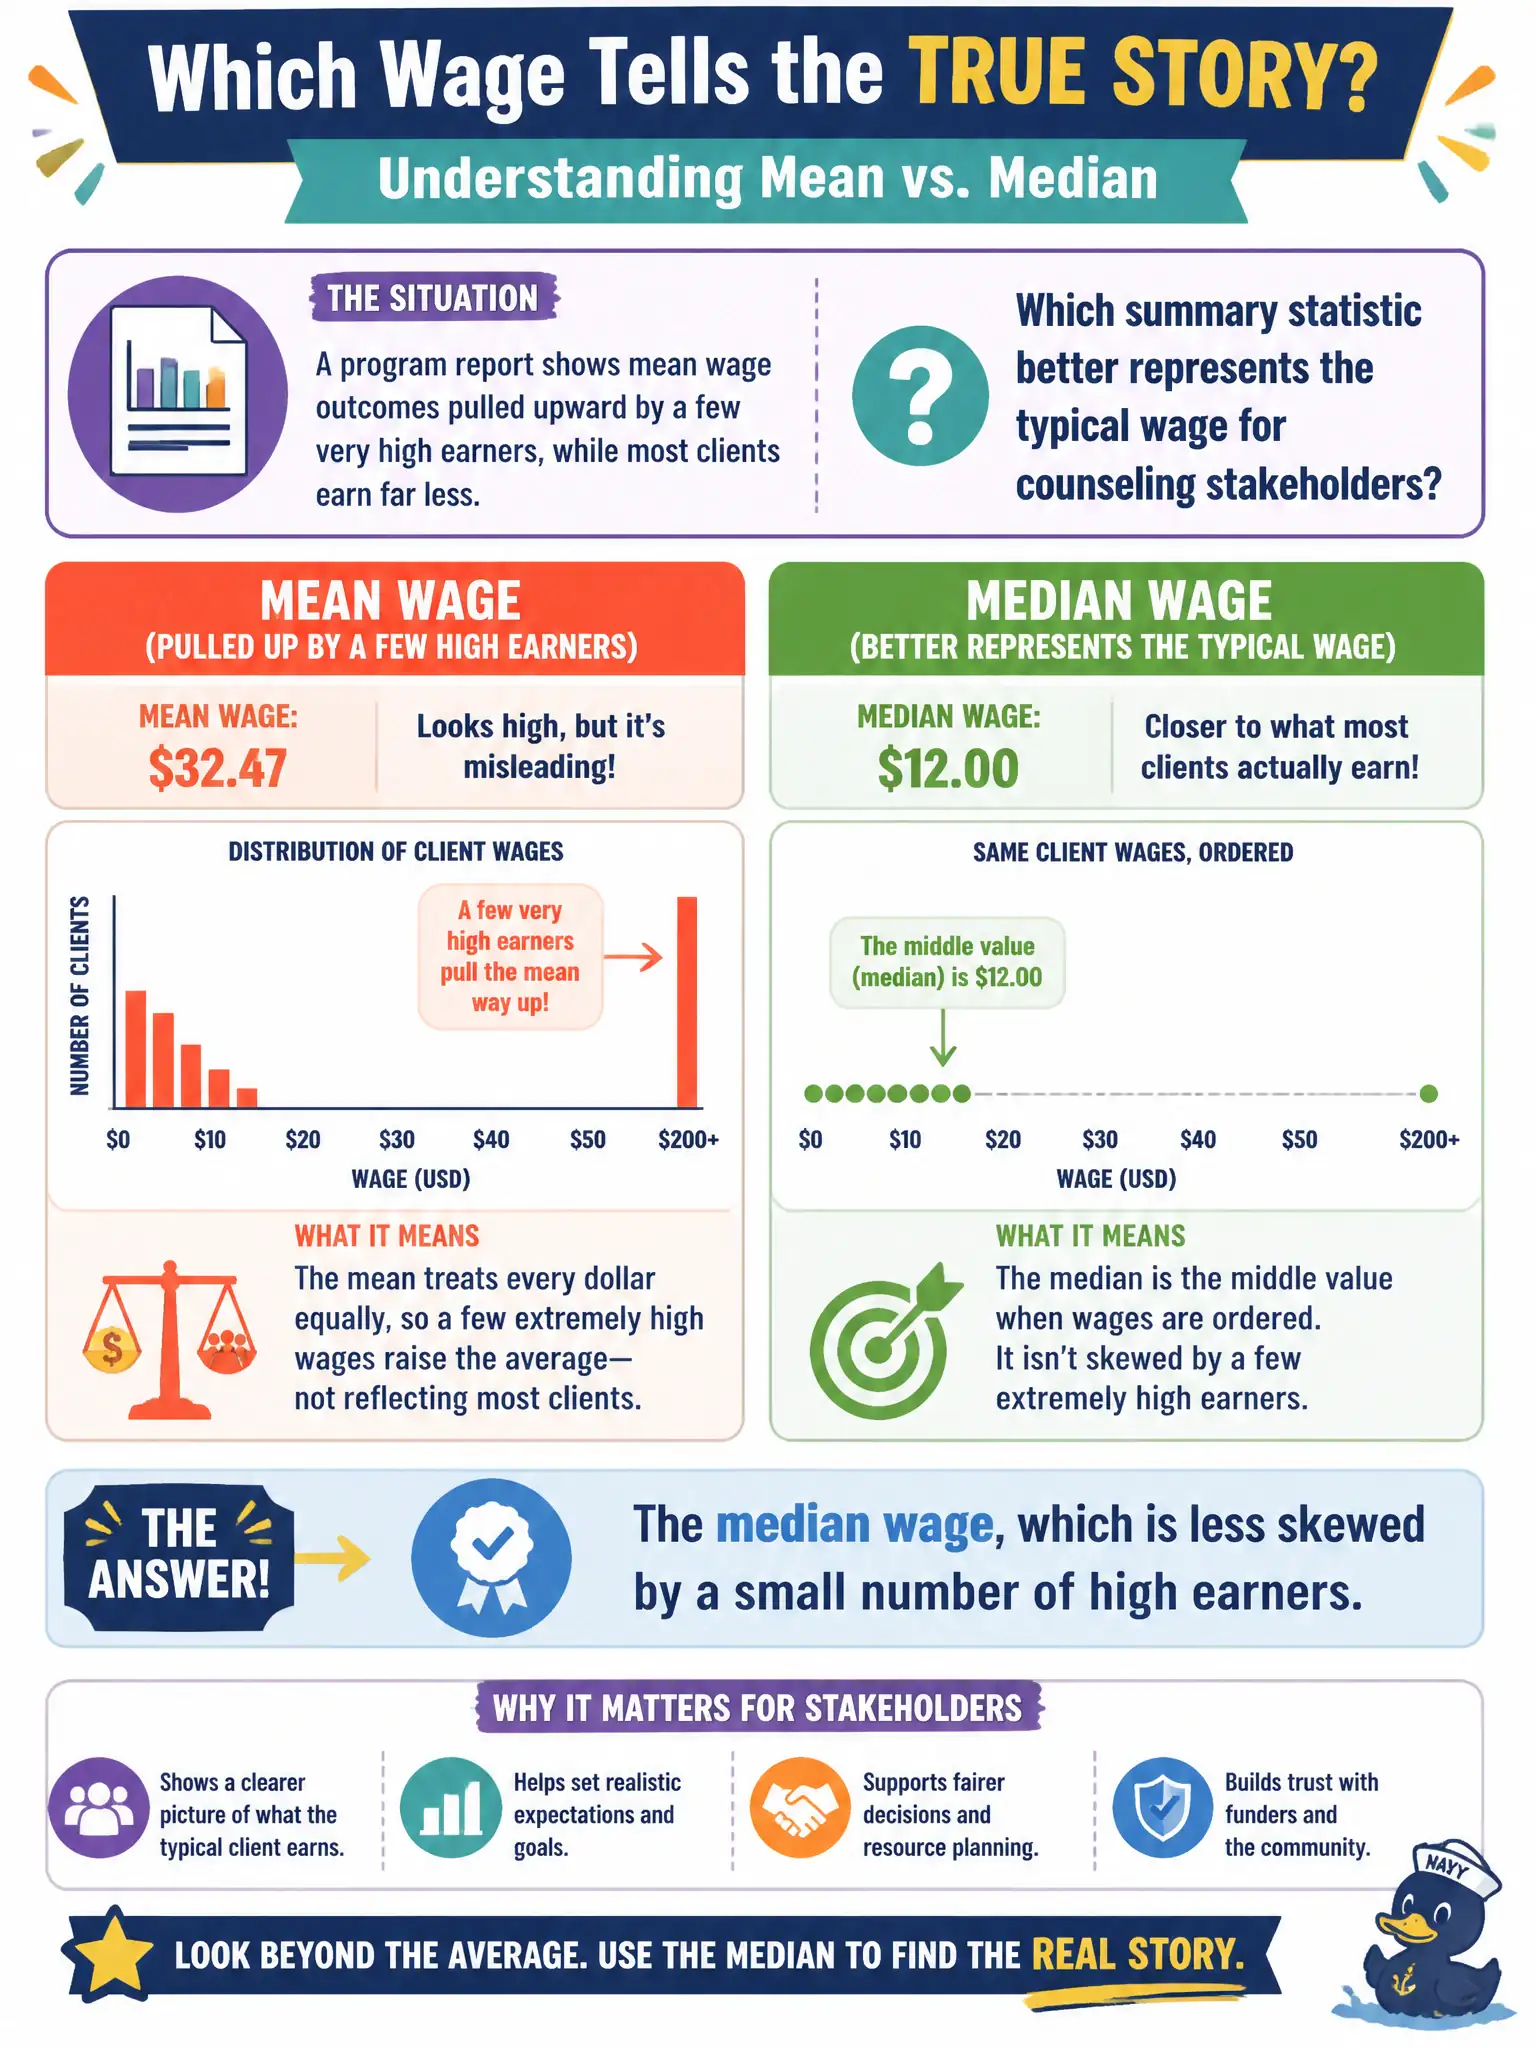
A program report shows mean wage outcomes pulled upward by a few very high earners, while most clients earn far less. Which summary statistic better represents the typical wage for counseling stakeholders?
Select an answer to reveal the explanation.
Short Explanation
A couple of big paychecks can yank the average sky-high like a balloon, leaving everyone else's wages looking fancier than they are. The median sits in the middle of the pack and tells a truer 'typical' story. Stakeholders deserve that clearer picture.
Full Explanation
When mean wage outcomes are pulled upward by a few very high earners while most municipal program clients earn far less, the median wage better represents the typical wage for counseling stakeholders because it is less skewed by extreme values. Transparent reporting prevents leaders from mistaking outlier success for typical civic client experience and improves honest grant storytelling. Relying on the mean alone because outliers never distort averages is statistically false in right-skewed wage data. Using the mode of job titles, which always equals typical wages, confuses occupational frequency with earnings level. Reporting the maximum wage only to showcase program success is marketing bias that hides central tendency from funders and staff. Exam caveat: means can still be reported alongside medians for completeness; the teaching point is choosing a resistant typical-value statistic when skew is known. Operational check: recompute outcome wages as median (and consider interquartile range), compare to the mean in the stakeholder report, and caption the civic dashboard so readers see typical earnings rather than outlier-inflated averages alone. In civic rehabilitation settings, documenting the rationale and verifying the next concrete step keeps practice aligned with CRC standards and client rights.