
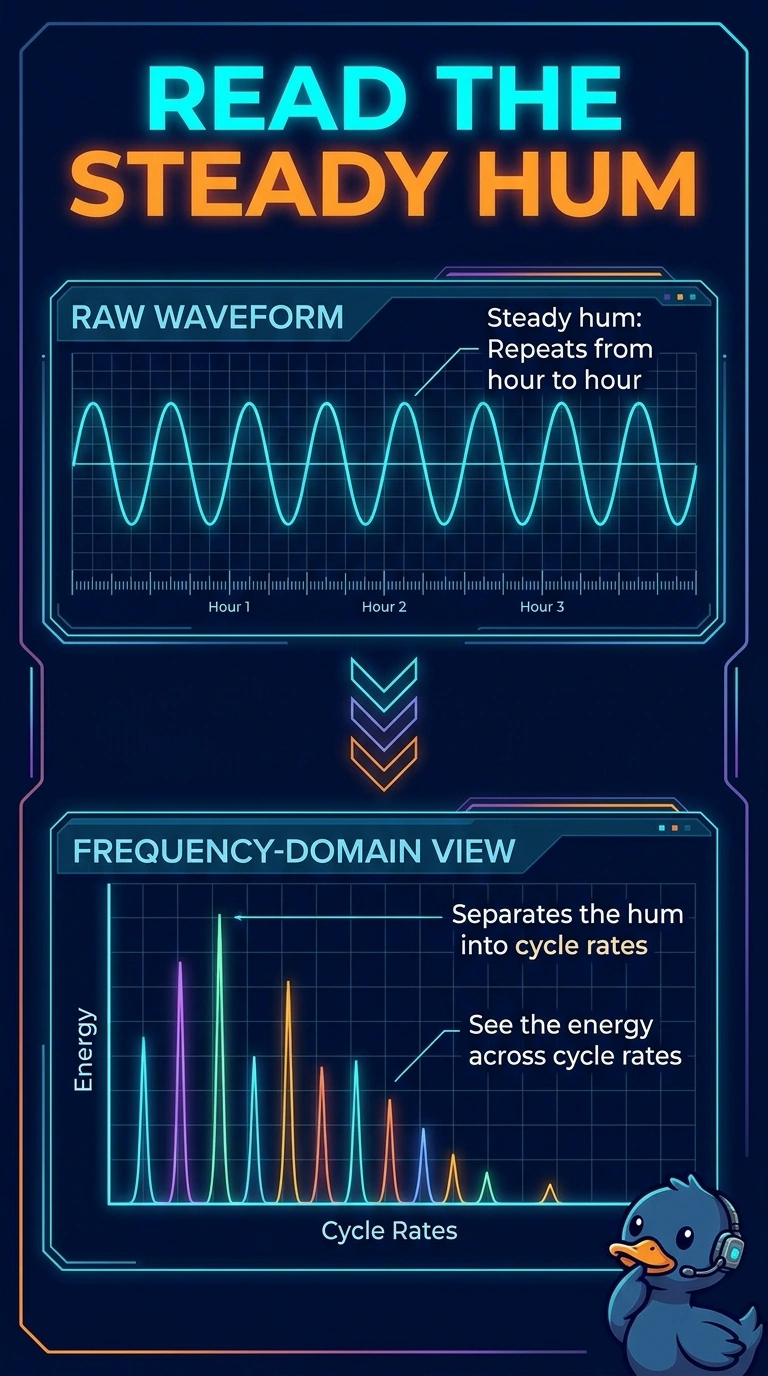
A utility monitors a turbine that hums in a steady repeat. The raw waveform looks nearly the same from hour to hour, and engineers need to see which cycle rates carry the energy. Which view makes that repeating structure easier to read?
Select an answer to reveal the explanation.
Short Explanation
A steady hum is a chord, and the raw wiggle barely shows the separate notes. You read the repeating structure more easily in the frequency domain, where the cycle rates pull apart. The trap is searching that steady hum for a single incident time it does not contain.
Full Explanation
A repeating vibration is easier to read as energy at each cycle rate than as a raw waveform that looks almost unchanged from hour to hour. The frequency domain separates that steady hum into those rates, which is the description the engineers asked for. An event detector stamps the time of a break in behavior, and this hum is described as steady, with no such break to mark. Compressing a model so it fits a handheld meter's memory and battery changes the size of the software and leaves the signal in the same hard-to-read form. Staying with the raw time waveform is the view the team already has, and the stem says that wiggle does not show which cycle rates carry the energy. Exam caveat: if the cycle rate itself later jumped, that jump could be studied as an event; describing this steady repeat is a different task. Operational check: produce a frequency view of a known steady hum and confirm the dominant cycle rate is obvious there and not obvious on the raw waveform alone. Keep the raw series archived beside that view so a later break in the hum can still be timed.