
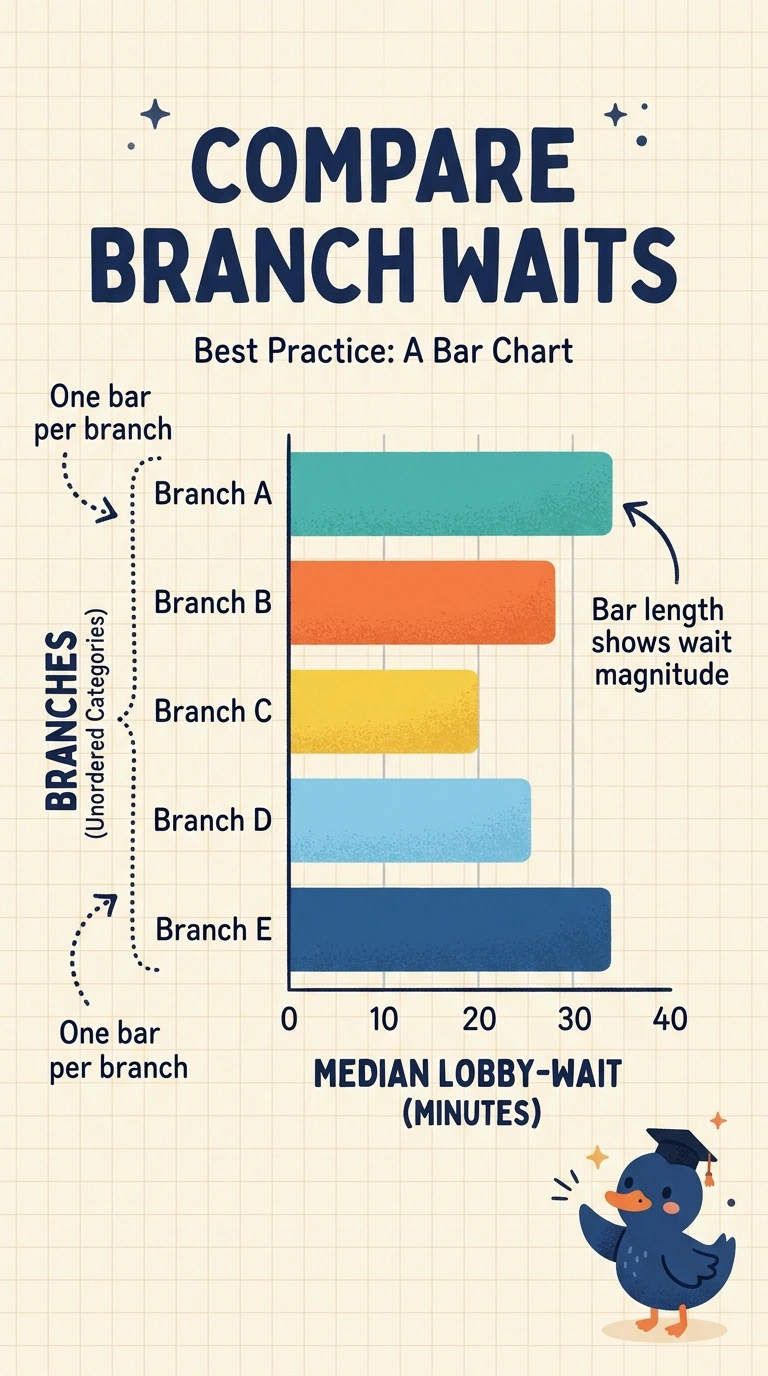
A bank wants to compare median lobby-wait minutes, a magnitude, across five branches, a category. Those five medians are separate summaries, not slices of one whole, and the branch names have no time order. Which chart matches the fields?
Select an answer to reveal the explanation.
Short Explanation
A pie says the pieces add up to one whole, and these branch waits do not. You match the chart to the fields: branch is a category and wait is a magnitude, so the length of a bar carries the comparison. The trap is a line that pretends branch names are moments in time.
Full Explanation
The kind of field picks the chart. Branch is an unordered category, median wait is a magnitude, and the five medians are separate summaries rather than shares of one total. A bar chart puts one bar on each branch and encodes the magnitude as length, which matches a category comparison of a size. A line chart connects points in order and reads as change over time; branch names have no time order, so the line invents a sequence the data do not have. A pie chart encodes parts of a whole, and these medians are not shares of one total, so the slice misstates the comparison. A scatter of arbitrary positions has no category axis and does not encode the wait, so it is not a chart of these fields at all. Exam caveat: if the comparison had been wait across weeks, a line on a time axis would match a time field; this comparison is branches. Operational check: read the finished chart and confirm each branch is its own bar, bar length is median wait, and nothing in the chart implies the five medians sum to one total.