
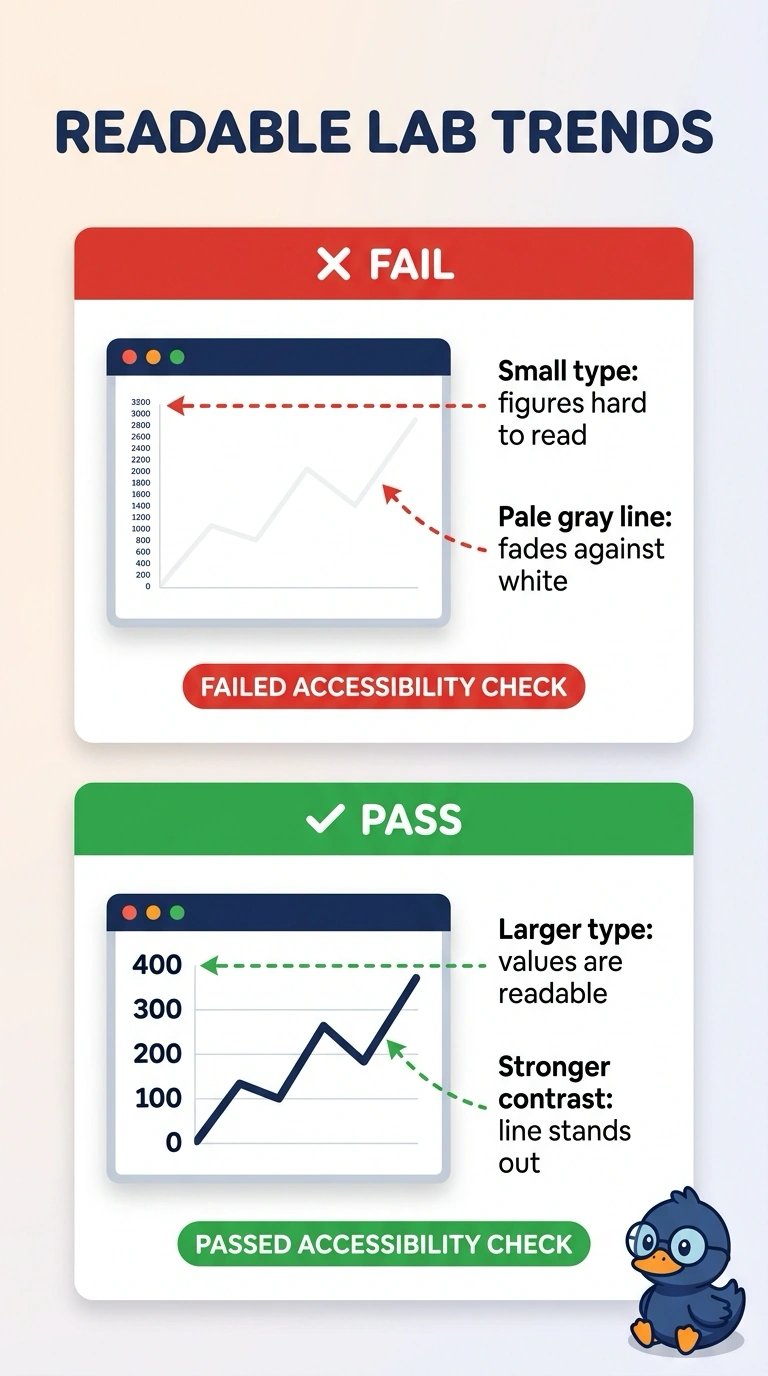
A hospital portal shows laboratory trends directly to patients. The values use very small type, and the trend line is pale gray on a white background. Patients say they cannot read the figures. Which failure does this design have?
Select an answer to reveal the explanation.
Short Explanation
Tiny pale type on a white page is a whisper in a bright room. You are looking at an accessibility failure of small type and low contrast, not a mix-up about which chart to draw. The trap is redesigning the geometry when patients simply cannot see the values.
Full Explanation
A patient-facing figure fails an accessibility check when the type is too small to read or the foreground does not stand apart from the background. Very small type and a pale gray line on white are that failure, and patients who cannot read the figures are reporting it directly. Connecting unordered categories as if they were times would be a mismatch between the chart and the field, and this stem describes type size and contrast rather than the wrong mark. Too many series would bury one comparison under other lines, and the stem does not describe a crowded set of series. Shipping figures without field definitions is a documentation gap, not the reason the line and the values cannot be seen. Exam caveat: a chart can use the right mark for the data and still fail when readers cannot perceive the type or the line. Operational check: open the portal on a typical patient display, read the values at a normal distance, and confirm the type is large enough and the line is distinct enough from the background that the figures can be read without guessing.