
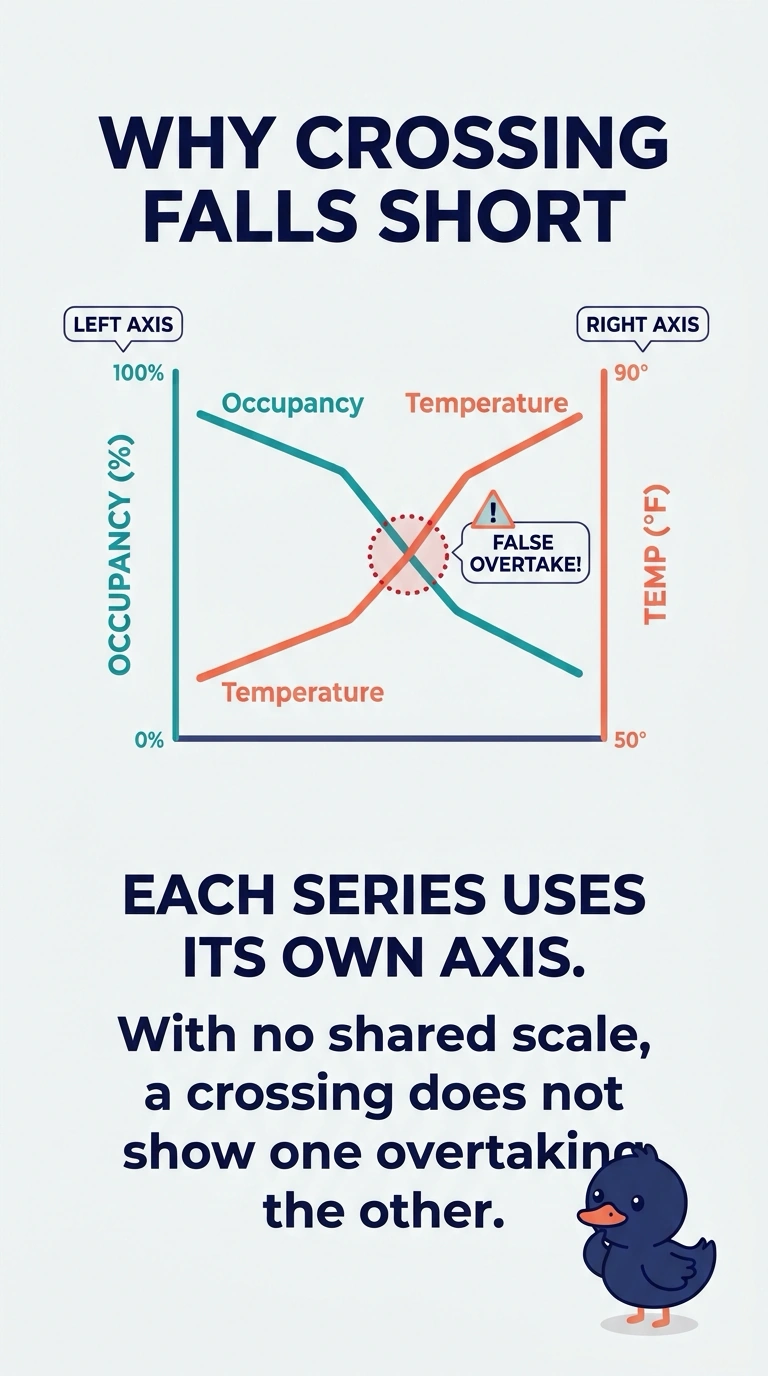
A city agency plots shelter occupancy on a left axis and overnight temperature on a right axis. The lines cross, and a briefing claims occupancy overtook temperature. Why is that comparison unsupported?
Select an answer to reveal the explanation.
Short Explanation
Two different rulers on one drawing do not make inches equal degrees. You cannot read a crossing of occupancy and temperature as an overtake when each line has its own axis. The trap is treating that picture as if both series shared a scale.
Full Explanation
Dual axes place two series in one frame while each keeps its own scale. Occupancy and temperature are different quantities, so a visual crossing or a similar slope only shows where the drawn lines meet, not that one quantity overtook the other. The left axis counts people in shelter and the right axis measures temperature, so matching heights are an artifact of how the two scales were drawn. The briefing's claim treats that crossing as a comparison the scales do not support. A vertical range cut off above zero would exaggerate a small change in a single series, which is not the fault described here. Encoding the lines by color alone would fail readers who cannot use that cue, but the unsupported claim is the overtake, not a missing pattern. Limiting the dates to favorable weeks would hide the rest of the season, yet the problem in this chart is the paired axes, not the window. Exam caveat: two axes can be honest when each unit is labeled and no crossing is read as a shared magnitude. Operational check: read both axis titles and units, then restate the claim only in words that do not compare occupancy counts with degrees.