
A bank risk report shows the monthly charge-off rate, which only edged up. The vertical axis starts just below the lowest point, and leaders read the line as a sharp deterioration. Which chart choice creates that exaggerated impression?
Select an answer to reveal the explanation.
Short Explanation
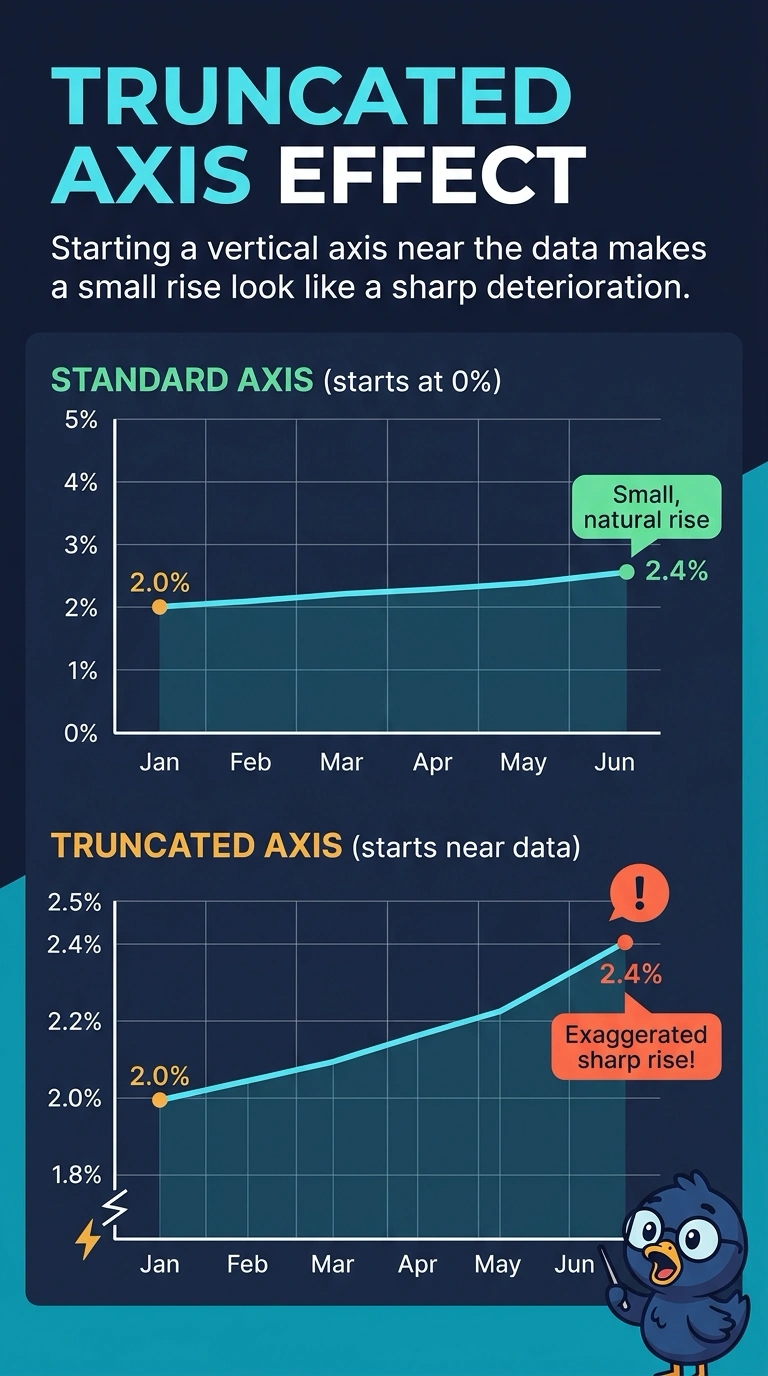
A short hill can look like a mountain when the map starts near its top. You can see how a truncated vertical axis turns a small charge-off rise into a picture of sharp deterioration. The misleading steepness comes from the axis, not a second scale, a shortened date window, or color alone.
Full Explanation
A truncated vertical axis begins near the observed values instead of at a baseline that shows the size of the move. The charge-off rate only edged up, but starting the axis just below the lowest point makes that small rise occupy most of the plot height, so the line looks like a sharp deterioration. A second vertical axis would invite a false comparison only if another series were drawn on its own scale, and this report describes a single rate. A shortened date window could hide months and the rest of the charge-off history, but the exaggeration here comes from the axis origin, not from which months were kept. Color as the only encoding could prevent readers who cannot use that hue from noticing the change, yet the misleading impression here is the steepness of the line, not a missing visual cue. Exam caveat: a labeled axis break can still be misread as a large change when the cropped range fills the frame. Practical check: redraw the monthly rate with the vertical axis starting at zero, or at another stated baseline, and confirm the rise no longer looks like a collapse.