
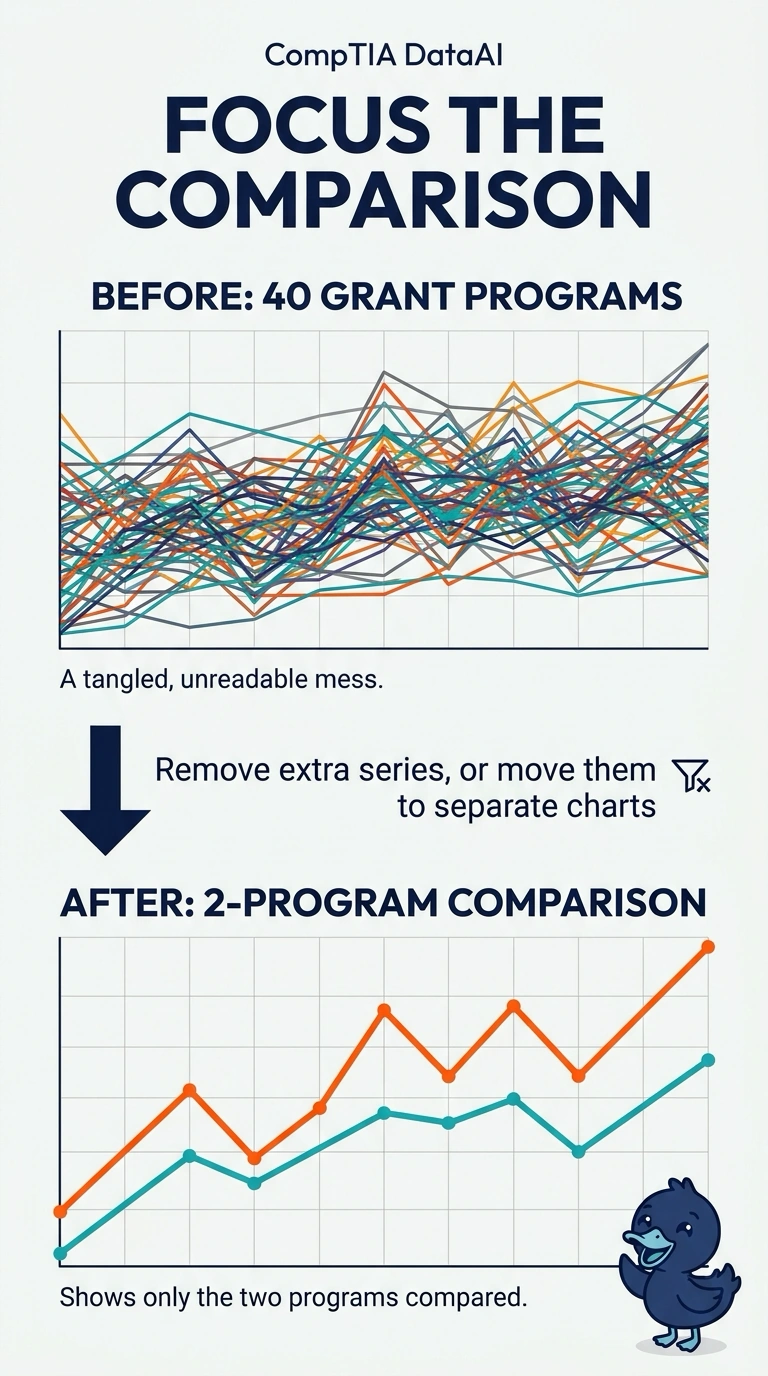
An agency line chart draws forty grant programs at once. Leadership asked to compare only two of those programs, and the other lines bury that pair. What change makes the requested comparison readable?
Select an answer to reveal the explanation.
Short Explanation
Forty pencils on one page hide the two lines you were asked to compare. You remove or separate the extra series so the comparison that matters is the one the chart shows. The trap is shrinking the type until every program fits and the pair is still buried.
Full Explanation
A chart should show the comparison the reader was asked to make. Forty grant-program lines on one set of axes bury the two-program pair leadership requested, so the extra series have to come off that chart or move to charts of their own. Shrinking the type until every label fits does not remove the overplotting; the two lines stay hidden in the crowd, and smaller type adds a second readability problem. A field dictionary can define the program names and still leaves all forty lines on the axes, so the comparison stays buried. Redrawing the two programs as pie slices while the other thirty-eight lines remain does not isolate the pair, and it mixes a part-to-whole mark into the same frame. Exam caveat: separate charts can keep the other programs available without placing them on the one comparison the reader needs. Operational check: hide every series except the two named programs and confirm the remaining picture is the comparison leadership asked for, with those two lines easy to tell apart.