
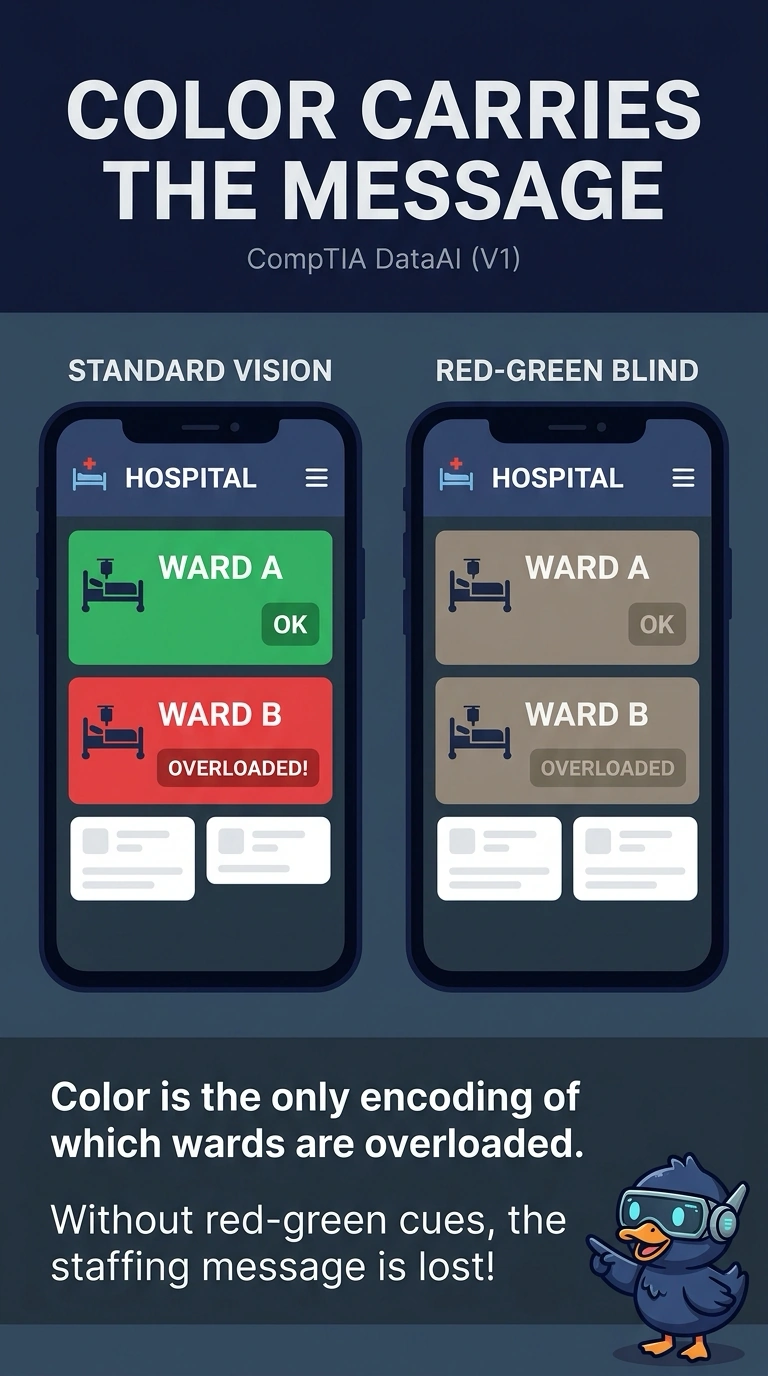
A hospital staffing board paints overloaded wards red and stable wards green, with no change in shape, pattern, or text. Several readers cannot tell those colors apart. What about this board fails those readers?
Select an answer to reveal the explanation.
Short Explanation
A traffic light with no sign fails anyone who cannot separate red from green. You encoded overload only as color, so readers who cannot use that cue cannot tell which wards are in trouble. The trap is diagnosing a cut-off axis or a dual axis that this board does not have.
Full Explanation
When color is the only channel that carries the meaning, a reader who cannot distinguish those colors loses the message. This board paints overloaded wards red and stable wards green and changes nothing else, no shape, pattern, or text, so the red-green cue is the entire encoding. A second axis would be a problem only if two measures were plotted on separate scales and then compared, and this board does not do that. A vertical axis that starts near the top of the range would exaggerate a small numeric gap, but the failure named here is the missing non-color cue, not the scale origin. Showing only the most recent days would hide history, yet readers who can see the colors still get the overload message, and readers who cannot see them get nothing. Exam caveat: color may stay in the board if shape, position, or a direct label also carries the overload status. Operational check: view the board in grayscale, or with the red and green rendered as the same shade, and confirm the overload status is still readable.