
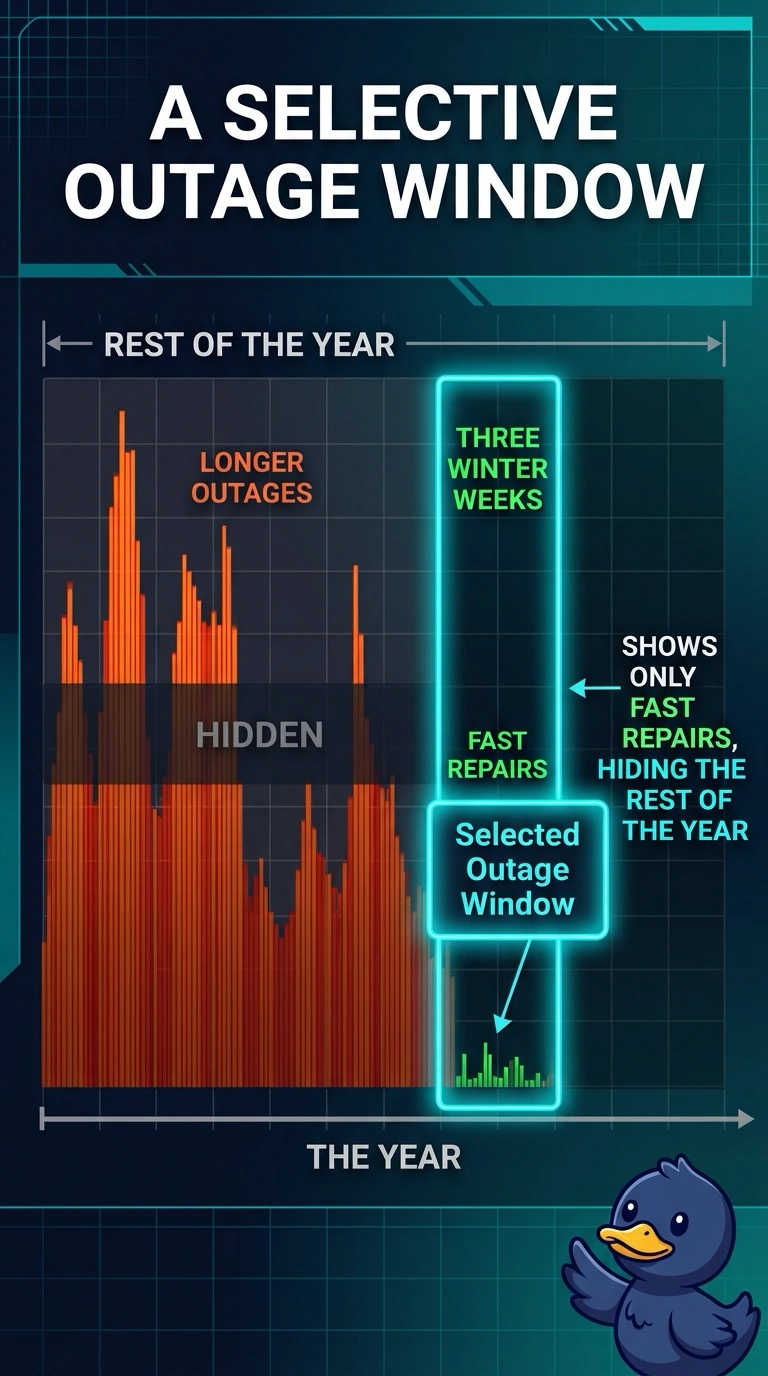
A utility shows regulators an outage chart that keeps only three winter weeks when repairs were fastest and drops the rest of the year, when outages ran longer. What is wrong with the displayed window?
Select an answer to reveal the explanation.
Short Explanation
A highlight reel of your best week is not the season. You hid the longer outages by keeping only the three fast winter weeks. The trap is scolding the axis scale when the problem is which dates were allowed onto the chart.
Full Explanation
A cherry-picked window shows the slice of a series that supports a claim and leaves out the rest. The regulator chart keeps three winter weeks when repairs were fastest and drops the remainder of the year, when outages ran longer, so the displayed window hides the longer outages. The omitted months are part of the outage record the chart claims to summarize, and dropping them changes a year-long story into a best-stretch story. A vertical axis starting above zero would exaggerate a small movement inside whatever dates were drawn, but it would not choose those dates. Putting outage duration and crew headcount on two axes would invite a false comparison of different units, and the stem describes one series with a cut calendar. Encoding speed only by color would fail readers who cannot use that cue, yet the missing information is the rest of the year, not a legend. Exam caveat: a short window is fair when the question is truly about those weeks and the longer record is shown beside it. Operational check: plot the full year of outage duration next to the three-week excerpt before the chart goes to regulators.